
One of the most severe dips in cryptocurrency history occurred in November 2022, when Bitcoin (BTC) plummeted to as low as ~$15,800 — a 72% decline from the all-time high at that time. The coin had been struggling with rising interest rates leading up to the crash, and FTX, one of the largest crypto exchanges, had just filed for bankruptcy, leading investor sentiment to hit rock bottom. “The Crypto Party is Over,” wrote The Wall Street Journal.
Fast forward to May 2025, however, and BTC is trading at almost $110,000 despite global economic uncertainty.
Indeed, U.S. Treasury yields have jumped, the 10-year rising to 4.459%, driven by mounting debt concerns, persistent inflation risks, and limited room for monetary easing. America’s debt has likewise surpassed no less than $36 trillion, and interest payments might very well reach $952 billion by 2025.
Meanwhile, “Digital Gold,” i.e., Bitcoin, is increasingly viewed as both a high-performing asset and a potential store of value. BlackRock’s IBIT spot exchange-traded fund (ETF,) for example, now holds about 3% of the total supply according to Bitget.
If you had the foresight to invest at, say, the average price of $16,500 per BTC at that time, you would have approximately 0.0601 BTC. Right now, Bitcoin is trading at around $109,800. Accordingly, that same 0.0601 BTC would now be worth about $6,606.49. That’s a gain of approximately 560.65% over just two and a half years — or a $5,606,49 profit.
This scenario perfectly illustrates how buying can be profitable when fear dominates the market, the kind of period often called a “bloodbath”. Historically, such periods provided investors with some of the greatest opportunities, as the numbers above indicate.
Of course, this isn’t unique to crypto. Similar patterns can be observed in stocks. For example, if you bought $1,000 worth of CrowdStrike (NASDAQ: CRWD) stock when it crashed in mid-2024, you would now hold approximately $1,496. However, given crypto’s extreme volatility, the magnitude of gains (and losses) can be much, much higher.
Risk and reward: Bitcoin price predictions
Of course, hindsight is always 20/20, and not every dip lays the groundwork for a bullish market. Remember: crypto is among the most volatile assets.
For instance, just days after hitting a new all-time high above $111,000 last week, BTC slipped below $110,000 again. Likewise, according to its relative strength index (RSI) of 71, according to Bitbo, Bitcoin is nearing overbought levels and might fall short.
Nonetheless, Bitcoin’s technical setup remains positive, with the 50-day and 200-day simple moving averages (SMA) comfortably lower at $95.587 and $94.157, respectively.
Looking ahead, the Bitcoin Rainbow Chart, for instance, forecasts a wide possible range, between $32,787 and $372,813 by June 1, with each color band reflecting market sentiment from extreme bearishness to intense overvaluation:
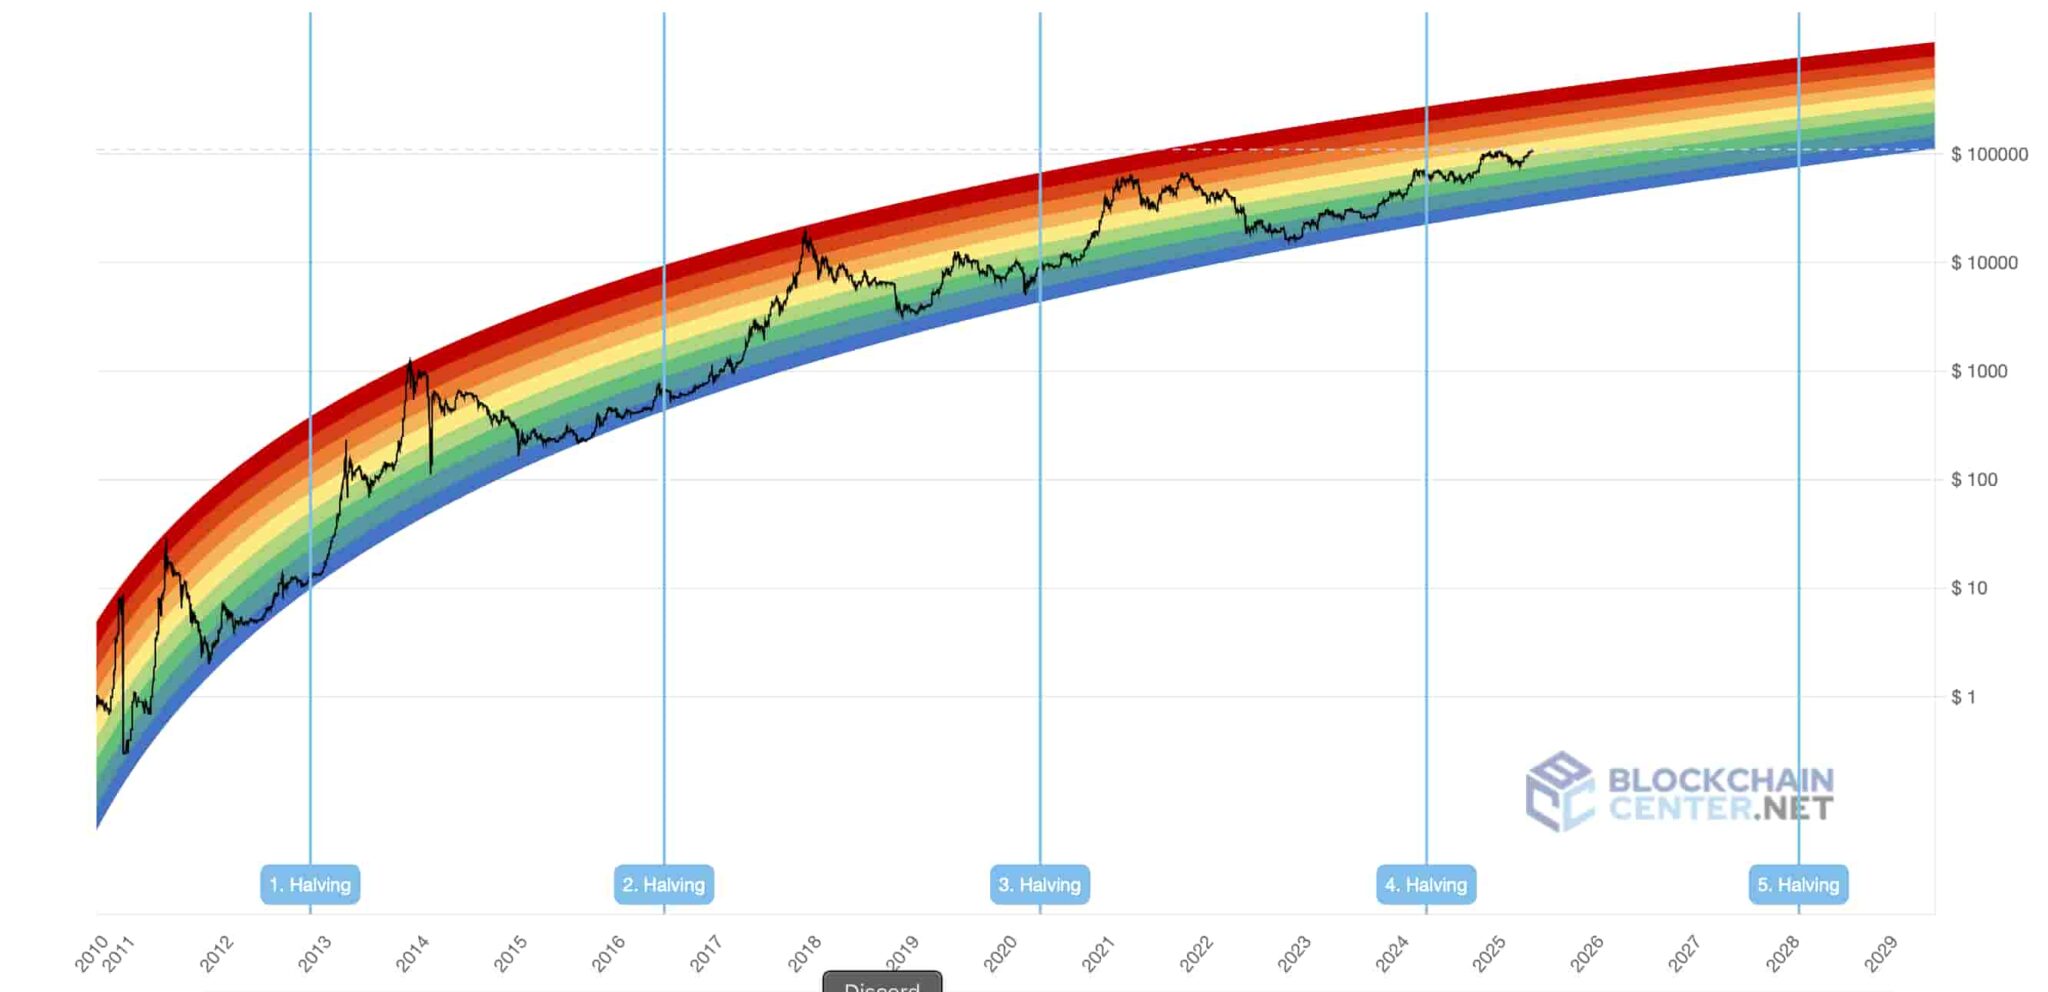
While not exactly a precise forecasting tool, the Rainbow Chart remains a popular reference for understanding Bitcoin’s long-term growth trend and investor psychology. This especially holds in periods when short-term volatility muddies the water.
Disclaimer: The content on this site should not be considered investment advice. Investing is speculative. When investing, your capital is at risk.
Featured image via Shutterstock