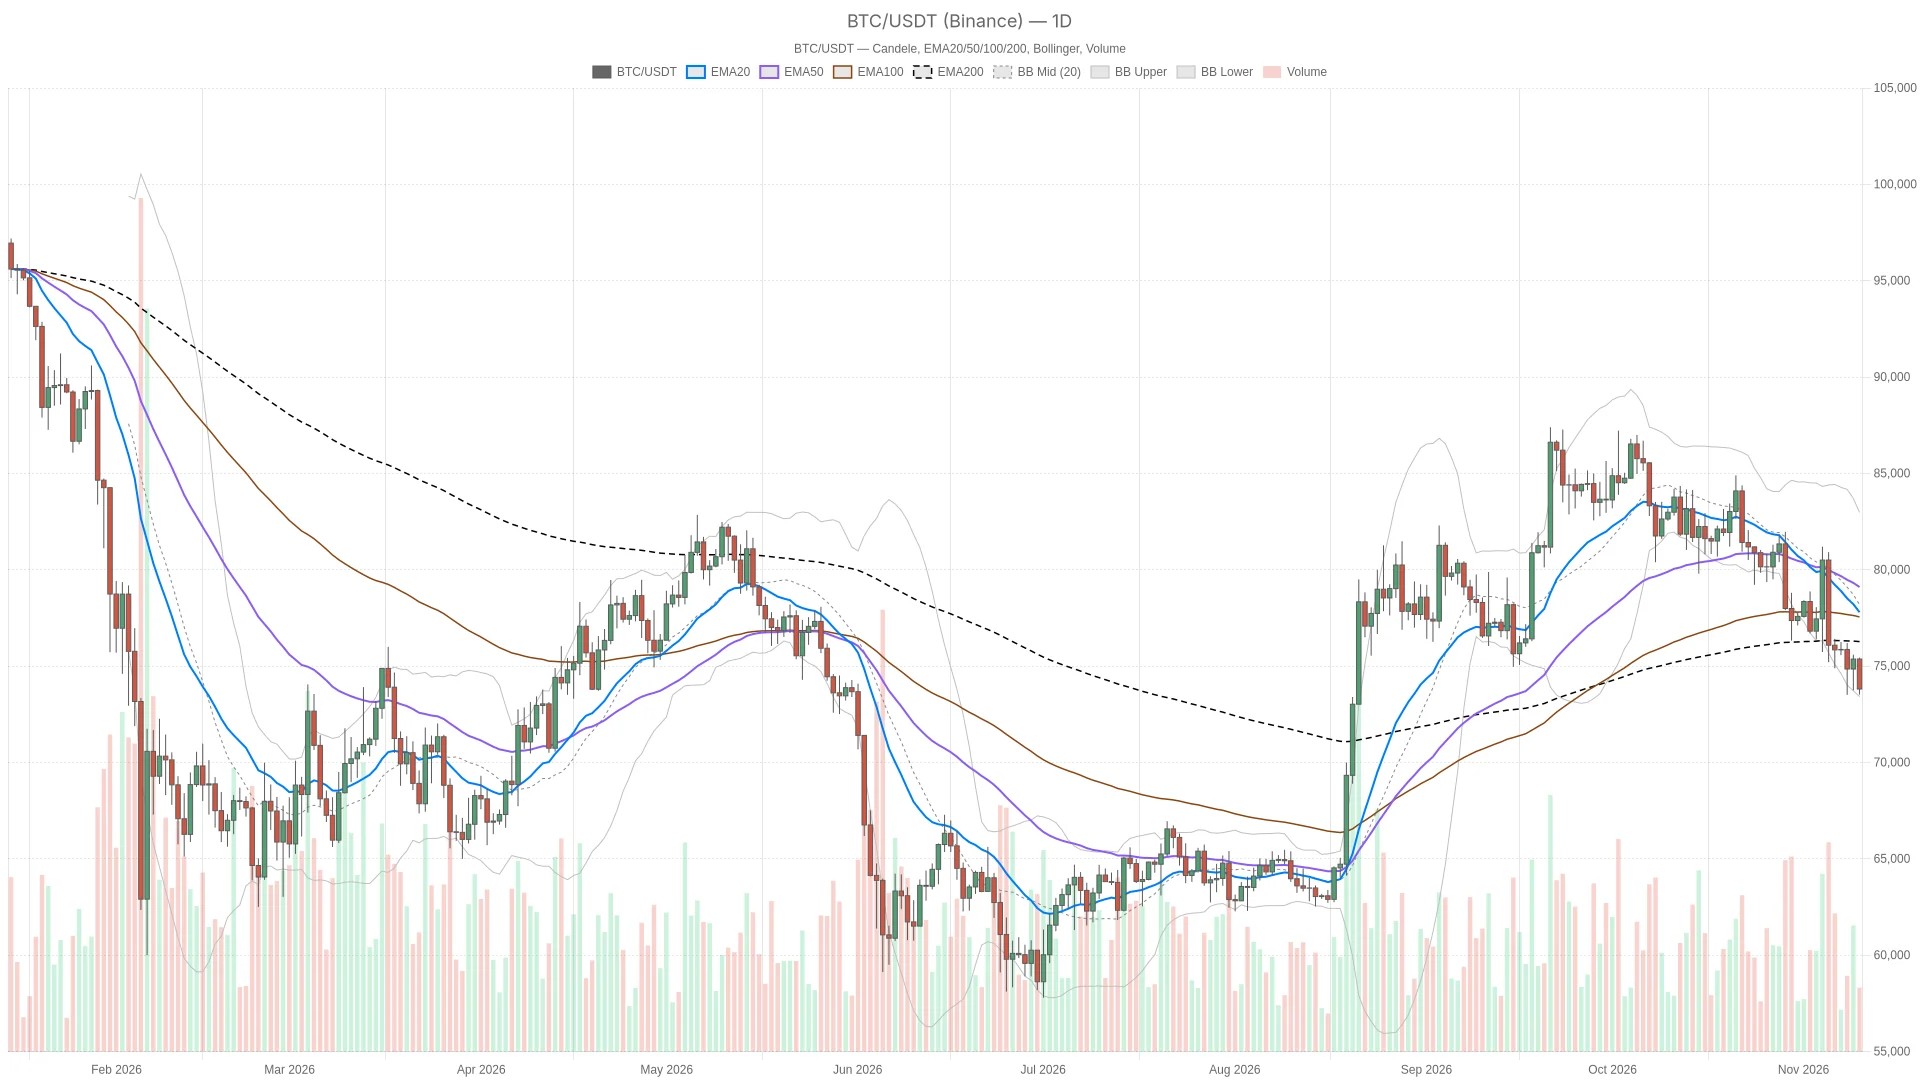
As of November 10, 2026, Bitcoin is trading at $73,814.01 on Binance. Its daily regime is neutral, but the setup is distinctly defensive. The price is below every tracked daily moving average and close to the lower daily Bollinger Band. The main scenario is neutral with a downside lean: the daily classification has not turned bearish, but the hourly structure puts immediate resistance in the way of a recovery.
The key tension is between a possible mean-reversion bounce and short-term momentum that continues to favor weakness. A rebound alone would not confirm a reversal; the nearby pivot structure would first need to be repaired. Prices cited here are live readings, while indicators and pivots are based on completed candles.
Bitcoin’s short-term structure is bearish, while the daily regime remains neutral
The daily picture is weak, but not decisively trending: the moving averages are not aligned, and neither daily RSI nor the MACD histogram has shown a directional trend across the latest completed readings. This limits the case for describing the move as an accelerating daily downtrend.
The hourly chart is less ambiguous. Price is below all three tracked EMAs, which are bearishly aligned, and momentum is deteriorating. The 15-minute chart also shows bearish EMA alignment, though its RSI is rising. That divergence matters for execution context: a brief bounce could develop without changing the hourly structure or daily bias.
Pressure near the lower band leaves little room for a clean recovery
Daily price is below the EMA20 at $78,216.54, EMA50 at $79,320.73 and EMA200 at $76,299.94. The averages are not arranged in textbook bearish order, but they all remain overhead. In practice, this mixed structure tempers the trend label without indicating strength.
Price is also below the EMA20, EMA50 and EMA200 on both the hourly and 15-minute charts, with both sets bearishly aligned. Any immediate rebound would therefore be a recovery against the prevailing short-term structure, not confirmation of a reversal.
The daily Bollinger range extends from $73,722.74 to $83,700.76, with a midpoint of $78,711.75. Price is near the lower boundary and well below the midpoint. This leaves room for mean reversion, but there is not yet evidence of a move back toward the center. On the hourly chart, price is below the lower Bollinger Band at $74,017.51, and it is also below the lower band on the 15-minute chart. These positions indicate downside extension, not an automatic reversal signal.
ATR is $2,262.12 daily, $485.34 hourly and $270.44 on the 15-minute chart. Given these volatility readings, small moves through nearby levels carry less weight than confirmation from a completed candle. ATR measures the scale of movement, not the direction of the next move.
RSI leaves room for a bounce, but MACD continues to favor short-term weakness
Daily RSI is 37.8, and its recent direction is flat. Hourly RSI is falling at 33.9, while 15-minute RSI is rising at 37.7. None of the current readings is oversold. The improvement in shorter-term RSI offers a tentative bounce signal, but the hourly reading does not confirm it.
Daily MACD has a negative histogram with a flat recent direction. The hourly and 15-minute histograms are also negative, and both are falling and widening in magnitude. The clearest conflict appears on the execution chart: RSI is improving while MACD is becoming increasingly negative. This is not enough evidence of a durable turn in momentum.
The hourly pivot marks the divide between a recovery attempt and another support test
Bullish scenario: an hourly close above the hourly pivot at $74,014.54 would trigger an initial recovery scenario. The hourly lower Bollinger Band at $74,017.51 lies just beyond it, so a marginal reclaim of the pivot could still be fragile. The next resistance is daily S1 at $74,212.53—despite its label, it is above the current price—followed by hourly R1 at $74,504.35. The daily pivot at $74,905.88 is another hurdle for a recovery. An hourly close below the daily lower Bollinger Band at $73,722.74 would invalidate this rebound scenario.
Bearish scenario: an hourly close below the daily lower Bollinger Band at $73,722.74 would trigger a continuation scenario toward hourly S1 at $73,259.07. The last completed hourly candle closed at $73,748.88, leaving that trigger pending. An hourly close back above the hourly pivot would invalidate this immediate breakdown scenario.
The likeliest false signal is a brief move back above resistance that fails to hold through a completed hourly candle, given the rising 15-minute RSI and worsening MACD. A downside wick through daily support could also reverse without confirming a breakdown. With price near the lower daily band, neither intrabar move warrants as much weight as a close.
ETF outflows and the inflation report add context to the technical uncertainty
ETF outflows are mounting ahead of the U.S. CPI report, adding a cautious backdrop to the weak hourly structure. Binance Research, meanwhile, says Bitcoin may benefit as global tightening slows. That conditional macro argument does not confirm a technical recovery.
Fear accompanies Bitcoin’s defensive technical position
Alternative.me’s Fear & Greed Index stands at 32, in the Fear category. This is consistent with a defensive reading of the chart, but sentiment alone does not establish a price floor.
CoinGecko puts total cryptocurrency market capitalization at $2,477,133,477,552.79 and Bitcoin dominance at 59.63%. These are current market levels, not evidence of a shift in dominance or a rotation into Bitcoin.
FAQ
Is Bitcoin’s main scenario neutral or bearish?
The daily regime makes the main scenario neutral, with a downside lean. The bearish hourly structure weakens the recovery case but does not change that daily classification.
Does the improving 15-minute RSI confirm a reversal?
No. The improvement conflicts with a falling, negative 15-minute MACD histogram and does not repair the bearish hourly EMA structure.
Disclaimer: This article is for informational purposes only and does not constitute financial advice, an investment recommendation, or a solicitation to buy or sell any financial instrument or cryptocurrency. The analysis provided is not indicative of future results. Investing in crypto assets and financial markets carries a high risk of capital loss. Always do your own research (DYOR) and consult a qualified financial advisor before making any decision.
Article produced with the assistance of artificial intelligence and reviewed by the editorial team.
Source: en.cryptonomist.ch. Adapted by NBTC.
Add A Comment
Comments are closed.