
Bitcoin has retreated to a significant price area associated with its 2024 all-time high. As $BTC continues its recent decline, a key technical support zone is coming into focus.
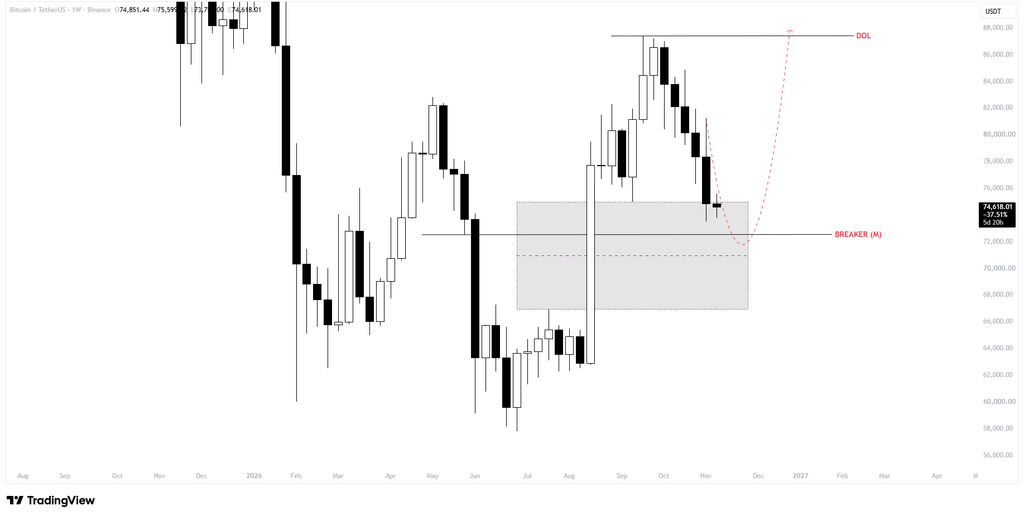
On the weekly Binance chart, Bitcoin is trading near $74,618, down from a recent high of about $87,500.
Bitcoin has now entered a key support zone where buyers could step in. The area includes a monthly breaker block and a weekly Imbalance Fair Value Gap (IFVG), two technical indicators traders are watching.
The main levels to watch are:
- $72,500: The key monthly breaker level.
- $67,000–$75,000: the broader support zone.
- $70,900: The weekly imbalance level.
If Bitcoin briefly dips below this support area to collect liquidity before recovering, buyers could get an opportunity to push the price higher.
Bitcoin Returns to Its Previous All-Time-High Region
Bitcoin’s return to this price range matters because it previously helped drive the asset’s rise to its 2024 all-time high. The recent decline has also filled a price imbalance formed during the 2024–2025 rally. This suggests that some of the market correction may already be over.
Rather than seeing the decline as a clear breakdown, traders could view it as a retest of an important historical price area where buyers may return.
Bitcoin’s recent price action is consistent with this possibility. After falling to around $58,000 earlier in the year, $BTC recovered and climbed to $87,500 around September and October.
But rejection at that high has sent Bitcoin back into the key support zone. The main question is whether buyers can defend the area and spark another upward move, or whether Bitcoin will fall further before recovering.
Follow us on X for real-time crypto updates.
Monthly Breaker Block Meets Weekly IFVG
The main level to watch is the monthly breaker block near $72,500. The highlighted support zone runs from $67,000 to $75,000, and Bitcoin is currently trading near the top of this range.
Another level to watch is the weekly IFVG near $70,900. It marks a price gap formed during a strong market move. Traders monitor such areas because prices often revisit them during corrections.
The weekly IFVG overlaps with the monthly breaker block, so the area between $70,900 and $72,500 could draw buyers.
Bitcoin could briefly fall below the support zone to collect liquidity before attempting a recovery. But this would not guarantee a reversal. Buyers would still need to show enough strength to push the price higher.
Can Bitcoin Recover to $87,500?
The chart marks $87,500 as Bitcoin’s next major upside target, also known as the Draw on Liquidity (DOL). The projected scenario is that Bitcoin could first fall toward the lower part of the support zone before recovering.
If buyers defend the $72,500 level and push Bitcoin back above important resistance levels, the likelihood of a move toward $87,500 could increase.
There are risks, however. A drop below the broader support zone, particularly below $67,000, would weaken the bullish outlook and could indicate that the correction has further to run.
Subscribe to our YouTube channel for the latest crypto news.
Related: Bitcoin Faces $57K Risk as Trump’s Political Power Weakens and Democrats Take Congress
Source: coinedition.com. Adapted by NBTC.
Add A Comment
Comments are closed.