

Bitcoin traded near $78,222 on the supplied Binance hourly chart after the October 30 sell-off. A bullish market structure shift brought $78,804 into focus, with $81,971 a higher objective. The price analysis arrived as prediction markets favored a Democratic congressional sweep ahead of Tuesday’s November 3 U.S. midterms. However, neither market provided evidence of politically driven $BTC purchases.
| Indicator | Value |
| $BTC Chart Price | $78,222 |
| Hourly Signal | Bullish MSS |
| First Upside Target | $78,804 |
| External Liquidity Target | $81,971 |
| Democratic Sweep Odds | 71%–73% |
Bitcoin’s Bullish MSS Sets $78,804 as First Test Toward $81,971
Bitcoin rebounded after a drop toward $76,000 on October 30. $BTC then printed higher short-term lows and interrupted its previous declining sequence. On the chart, price analysis identified a bullish market structure shift near $78,100.
A green support band between $77,900 and $78,000 became a test of that shift. That price analysis places $78,804 at internal range liquidity, where recovering momentum faces its next charted hurdle.
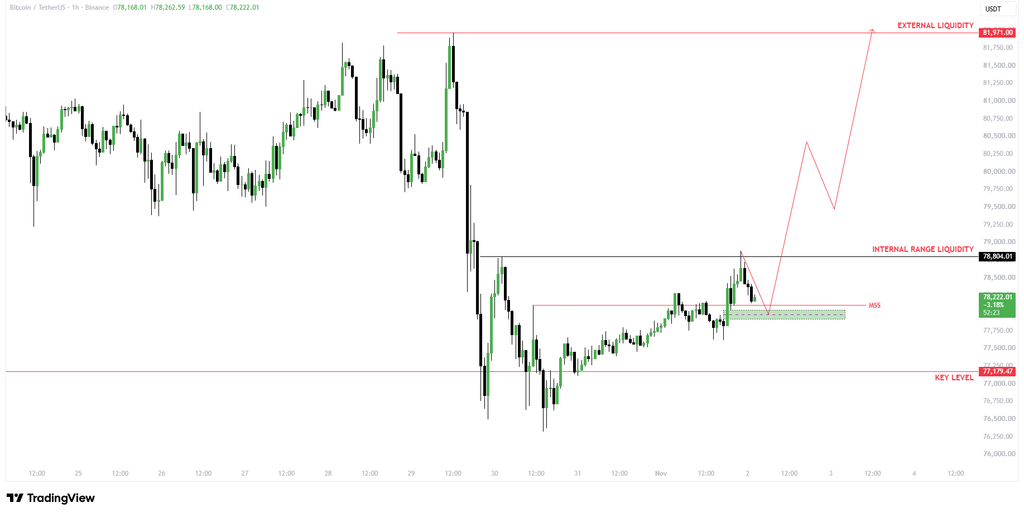
Beyond that level, $80,000 precedes external liquidity at $81,971. However, $BTC remained below the first objective in the supplied snapshot. The same price analysis identifies $77,179 as a downside reference if support breaks. Those levels define near-term boundaries.
Democratic Sweep Odds Near 70% Before November 3 Midterms
Meanwhile, political expectations shifted ahead of the November 3 midterms. Kalshi put a Democratic takeover of both chambers near 71% on November 2, while Polymarket’s comparable contract stood near 72%, up five percentage points over the preceding week.
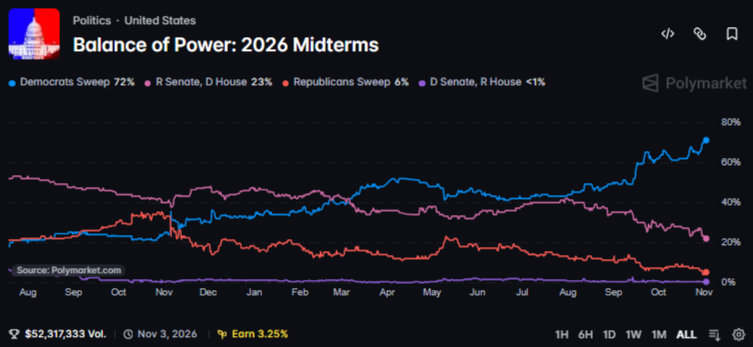
Those figures, however, reflect implied probabilities, not election results. Despite Bitcoin’s recovery, neither market identifies $BTC buyers or proves political positioning. Nevertheless, congressional control can influence cryptocurrency oversight.
Democratic committee leaders could prioritize investigations and consumer protections instead of industry-backed legislation, including the stalled CLARITY Act. That distinction matters for price analysis.
Meanwhile, a survey of 301 investors found 71% expected Bitcoin below its late-September reference price under Democratic control. However, the unweighted poll measured longer-term expectations, not confirmed trading behavior.
Follow us on X for real-time crypto updates.
Binance Fallout Adds Pressure as $BTC Defends Hourly Support
The rebound also occurred after a reported $6.3 billion Binance theft, which preceded a six-week Bitcoin low. The exchange recorded $3.64 billion in net withdrawals after reopening.
Those figures add market context, but price analysis alone cannot isolate their influence on $BTC buying, selling, or liquidity. U.S. employment releases and central-bank decisions were also on the calendar. As a result, price analysis faces several concurrent developments rather than one verified catalyst.
With Bitcoin above highlighted support in the chart snapshot, $BTC still traded below $78,804. The chart therefore leaves $77,900–$78,000 support, $78,804 resistance, and $81,971 external liquidity as reference levels. As a result, direction remained unconfirmed before voting.
Key Bitcoin Price Levels
| Price Level | Technical Significance |
| $81,971 | External liquidity target |
| $80,000 | Psychological resistance |
| $78,804 | Internal liquidity resistance |
| $78,100 | Bullish MSS reference |
| $77,900–$78,000 | Immediate support zone |
| $77,179 | Downside reference |
Bullish Case
Holding $77,900–$78,000 and clearing $78,804 could open a move toward $80,000 and $81,971.
Bearish Case
Losing MSS support would weaken $BTC’s bullish momentum and expose the $77,179 downside reference.
FAQs
$78,804 comes first, followed by $80,000 and $81,971.
The hourly chart shows a break above the previous short-term swing structure.
The $77,900–$78,000 zone supports the bullish recovery.
No direct causal connection has been established.
Subscribe to our YouTube channel for the latest crypto news.
Related: Ethereum Price Prediction November 2026: Can ETH Reach $2,415 or Fall to $2,170 in November?




Add A Comment
Comments are closed.