Bitcoin’s (BTC) price has surged by 5% over the past 24 hours, reaching $71,000 — a level unseen since March and just 4% below its all-time high.
Despite the bullish momentum, concerns are mounting about a potential market correction that could cause widespread liquidations of leveraged positions. This analysis breaks down the factors at play and highlights critical points for BTC holders to watch closely.
Bitcoin Market Begins To Overheat
Bitcoin’s price hike has been accompanied by a corresponding surge in its open interest. At $44.44 billion as of this writing, the coin’s open interest has noted a 10% rally in the past 24 hours and currently sits at a new all-time high.
Open interest represents the total number of outstanding contracts on a futures market. Although the rise in an asset’s open interest is a bullish signal, which signals heightened engagement amongst market participants, it comes with significant risks.
High open interest often means more leveraged positions are active. When prices move quickly, these positions are more susceptible to forced liquidations, which can lead to sharp price swings. With high open interest, even small price changes can lead to significant liquidations or margin calls.
Read more: What Happened at the Last Bitcoin Halving? Predictions for 2024
Bitcoin Open Interest. Source: Coinglass
Moreover, when a large volume of traders are positioned similarly, it can create an imbalance. If the market moves in the opposite direction, liquidations can occur, driving prices down and leading to a rapid reversal.
This is the case with Bitcoin, with more than half of the opened positions in its futures market betting on continued price growth. According to Coinglass, the BTC long/short ratio has reached a monthly high, with over 50% of the volume now dominated by long positions.

Bitcoin Long/Short Ratio. Source: Coinglass
This high ratio generally suggests a strong bullish sentiment among traders, as the majority are betting on Bitcoin’s price continuing to rise. However, such an imbalance between long and short positions comes with many risks.
If Bitcoin’s price drops, these long positions could face rapid liquidation. This could trigger a cascade effect where forced selling further drives the price downward.
BTC Price Prediction: Watch This Price Range
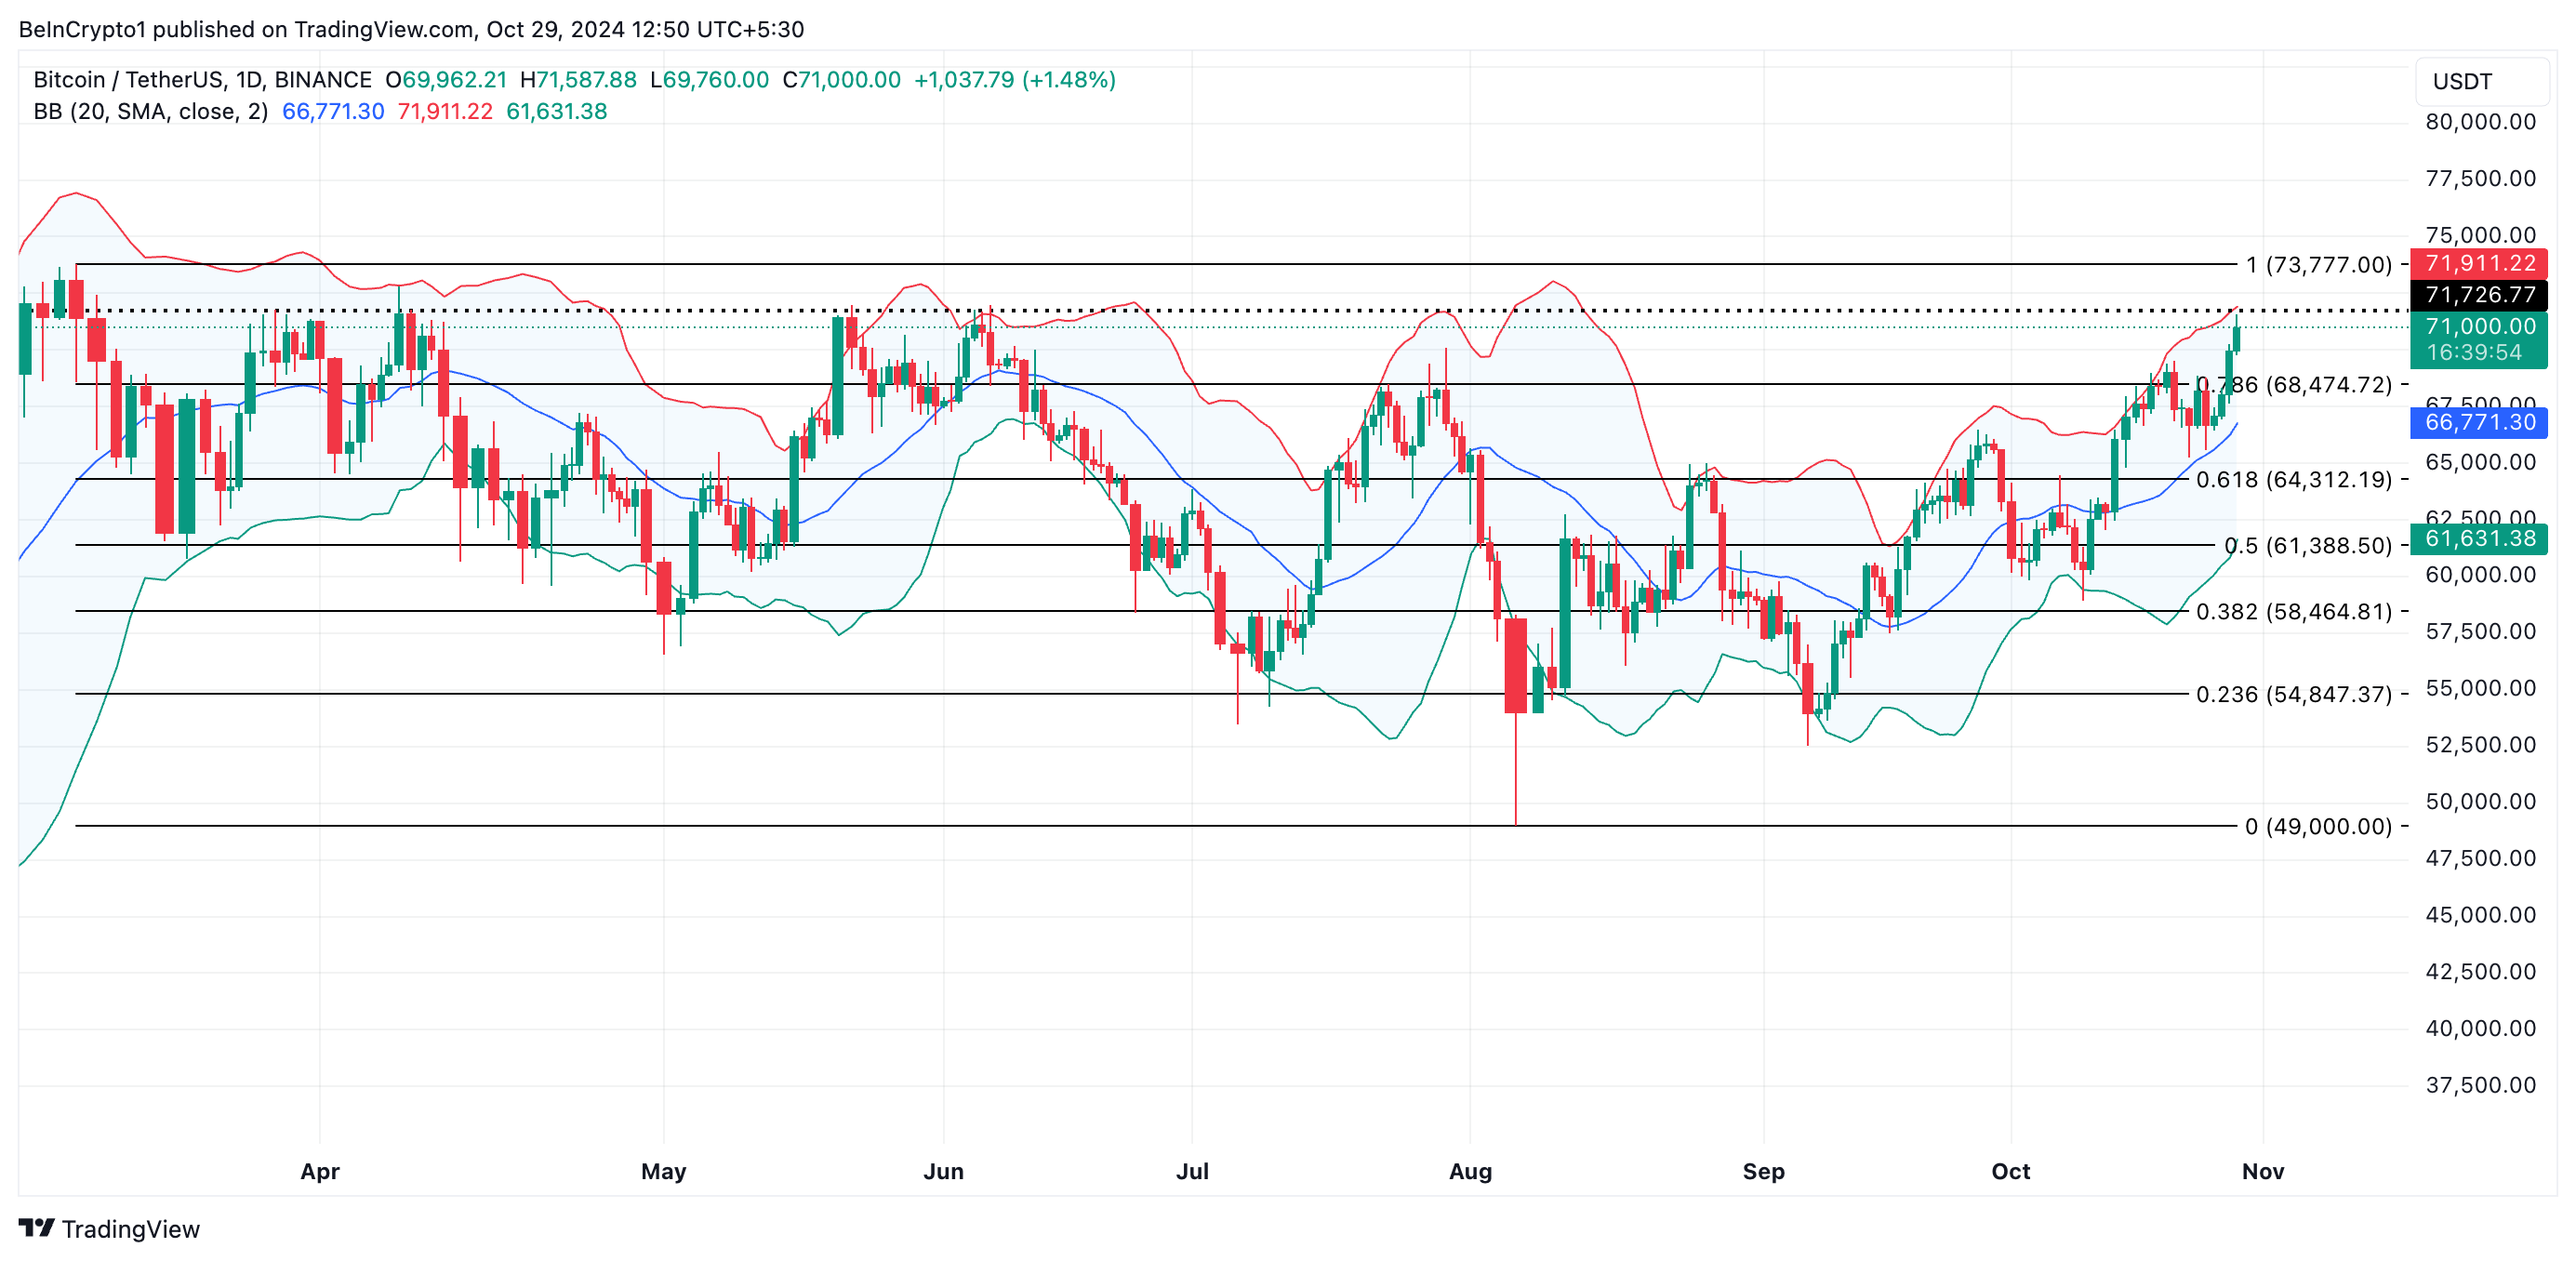
BeInCrypto’s assessment of the BTC/USD one-day chart confirms the Bitcoin market’s gradually overheating state. At press time, the coin’s price is poised to break above the upper band of its Bollinger Bands indicator, which measures market volatility.
Trading above the upper band of this indicator suggests that the asset has entered an overbought territory. This increases the likelihood of a pullback, as traders may begin to take profits.
If Bitcoin’s price fails to hold above the upper band and falls back within it, this could signal a potential reversal or weakening momentum, which may prompt further selling. Should such a reversal occur, the coin’s price may plummet to $68.474.

Bitcoin Price Analysis. Source: TradingView
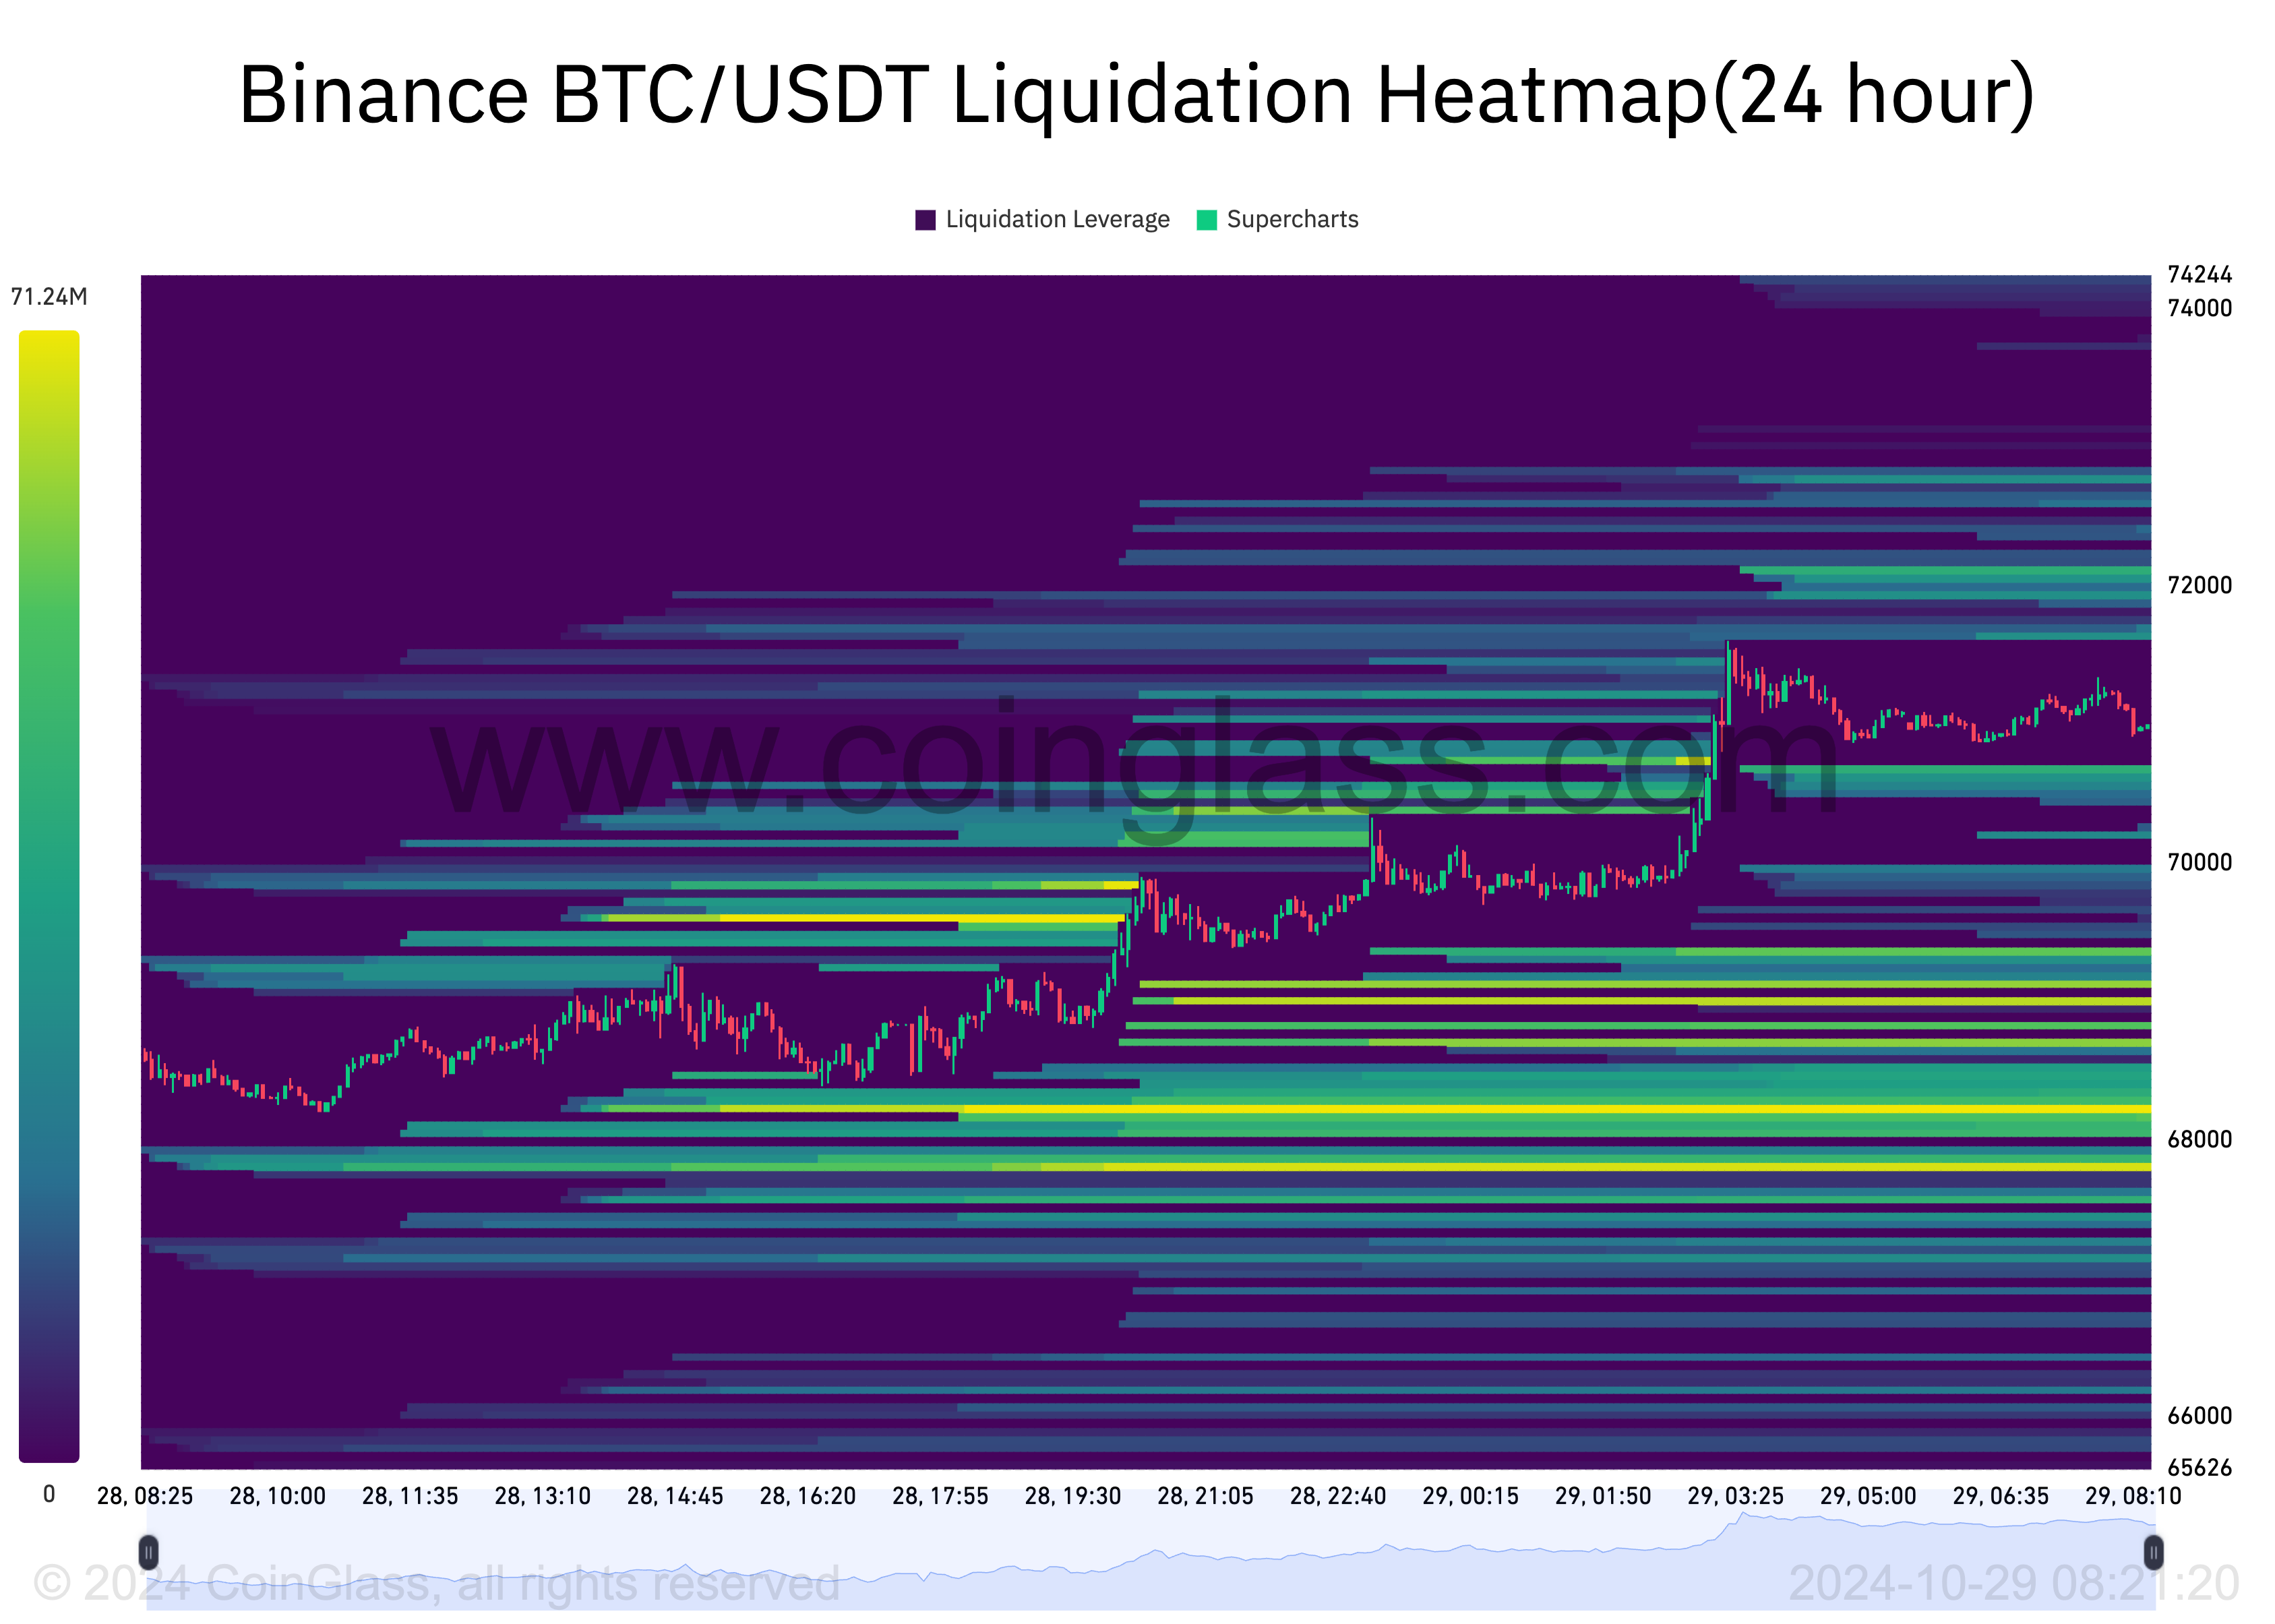
Furthermore, the $67,000 to $68,000 price range is an area to pay attention to. Bitcoin’s liquidation heatmap shows concentrated liquidity within that price range. Many traders have likely placed leveraged long positions at or near this level. If Bitcoin’s price declines and reaches this level, these leveraged positions could be liquidated.
Read more: Bitcoin Halving History: Everything You Need To Know

Bitcoin Liquidation Heatmap. Source: Coinglass
On the other hand, a pullback to this price range could also result in a buying frenzy. If the buying pressure is strong enough, Bitcoin’s price could break above its recent highs and continue its upward trend, attempt to breach resistance at $71,726, and aim for the all-time high of $73,777.

