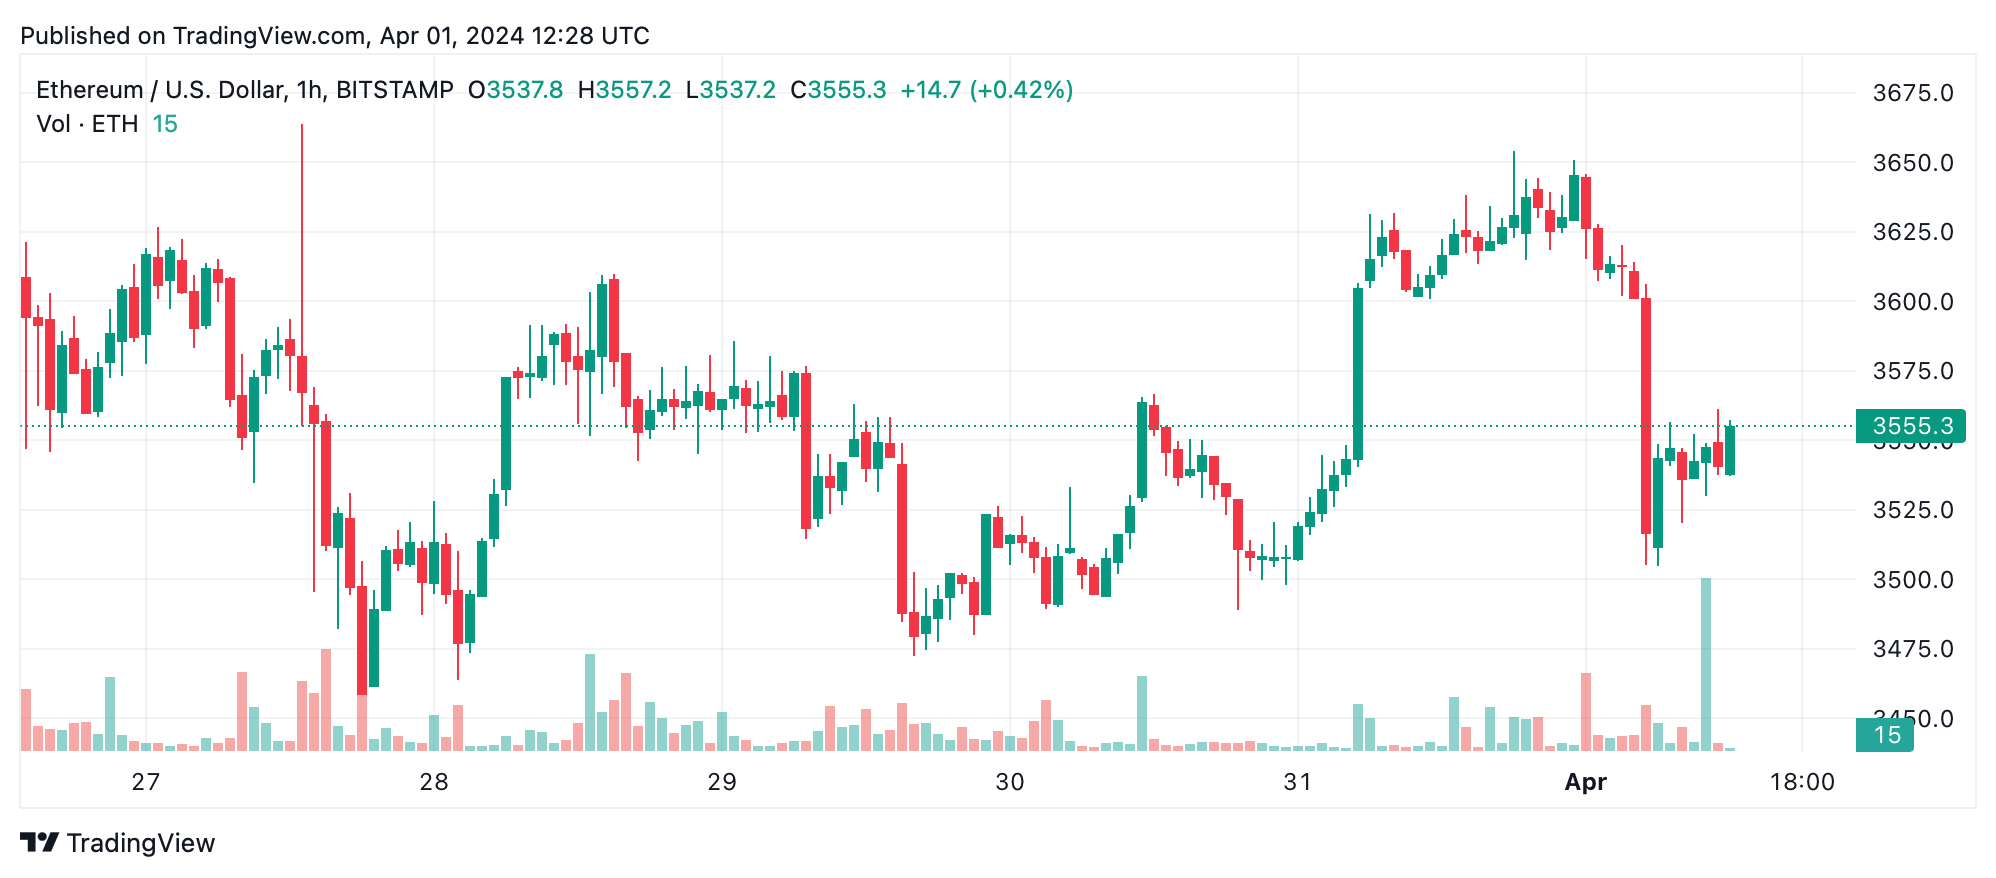
As ethereum hovers around $3,543, the cryptocurrency’s technical indicators and chart patterns present a nuanced picture of its current market dynamics. Amidst a blend of neutral oscillators and mixed moving average signals, ethereum’s technical analysis reveals key insights for traders.
Ethereum
Ethereum’s price dynamics on April 1, 2024, showcase a cryptocurrency in the throes of market indecision, as evidenced by the 1-hour and 4-hour chart summaries. The oscillation between the recent ups and downs highlights a battleground between buyers and sellers, with significant selling pressure followed by periods of stabilization and recovery.
Ether’s daily chart extends the narrative of a market at a crossroads, where large drops signify an overarching downtrend, yet are interspersed with upswings indicating resilience among traders. This pattern suggests the possibility of consolidation or temporary bullish rallies within a broader bearish context.
ETH/USD daily chart on April 1, 2024.
Oscillators and moving averages (MAs) offer a kaleidoscope of trader sentiment and market momentum, with a mixed bag of bullish and bearish signals that underline the complexity of ethereum’s current valuation. The neutrality of most oscillators, combined with diversity in MA directions, reflects a market in search of direction, punctuated by moments of optimism as certain indicators suggest bullish sentiment amidst prevailing uncertainty.

ETH/USD hourly chart on April 1, 2024.
The nuanced reading of ethereum’s technical indicators—ranging from the relative strength index (RSI) and moving average convergence divergence (MACD) levels to a variety of MAs—demands a sophisticated approach to trading decision-making. While the presence of neutral oscillators signals a market equilibrium, the divergence in moving average actions provides a rich tapestry for analysis, indicating potential shifts beneath the surface.
Bull Verdict:
Ethereum’s current technical analysis, marked by occasional bullish signals amidst neutral oscillators and a diverse set of moving averages, suggests a cautiously optimistic outlook. Despite the market’s recent volatility and periods of selling pressure, the resilience shown through recovery attempts and the bullish indicators, such as the bullish signals from the momentum oscillator and several MAs, hints at underlying strength.
Bear Verdict:
Conversely, ethereum’s technical landscape also presents a case for caution from a bearish perspective. The dominance of large slides on the daily chart, alongside a mixed signal from oscillators and moving averages, points to an unsettled market with potential for further downside. The current market dynamics, characterized by a struggle for direction and the presence of sell signals from key indicators such as the MACD Level, highlight the risk of a downtrend continuation.

