
[ad_1]
Bitcoin traded between $94,089 and $94,305 over the last hour, while its market capitalization stood at $1.86 trillion. Daily trade volume reached $19.74 billion, with the 24-hour price range spanning $93,806 to $95,741.
Bitcoin
On the 1-hour chart, bitcoin continues to reflect a short-term bearish structure, following a consistent series of lower highs and lower lows from the local peak at $96,620. The most notable signal comes from a red volume spike around $93,550, which suggests intensified selling pressure and limited participation from buyers on rebounds. This behavior is characteristic of a descending channel or potential bear flag pattern. Given the ongoing weakness, a breakdown below $93,550 could trigger further declines, while recovery potential exists only if the price manages to reclaim the $95,000 level backed by strong volume.
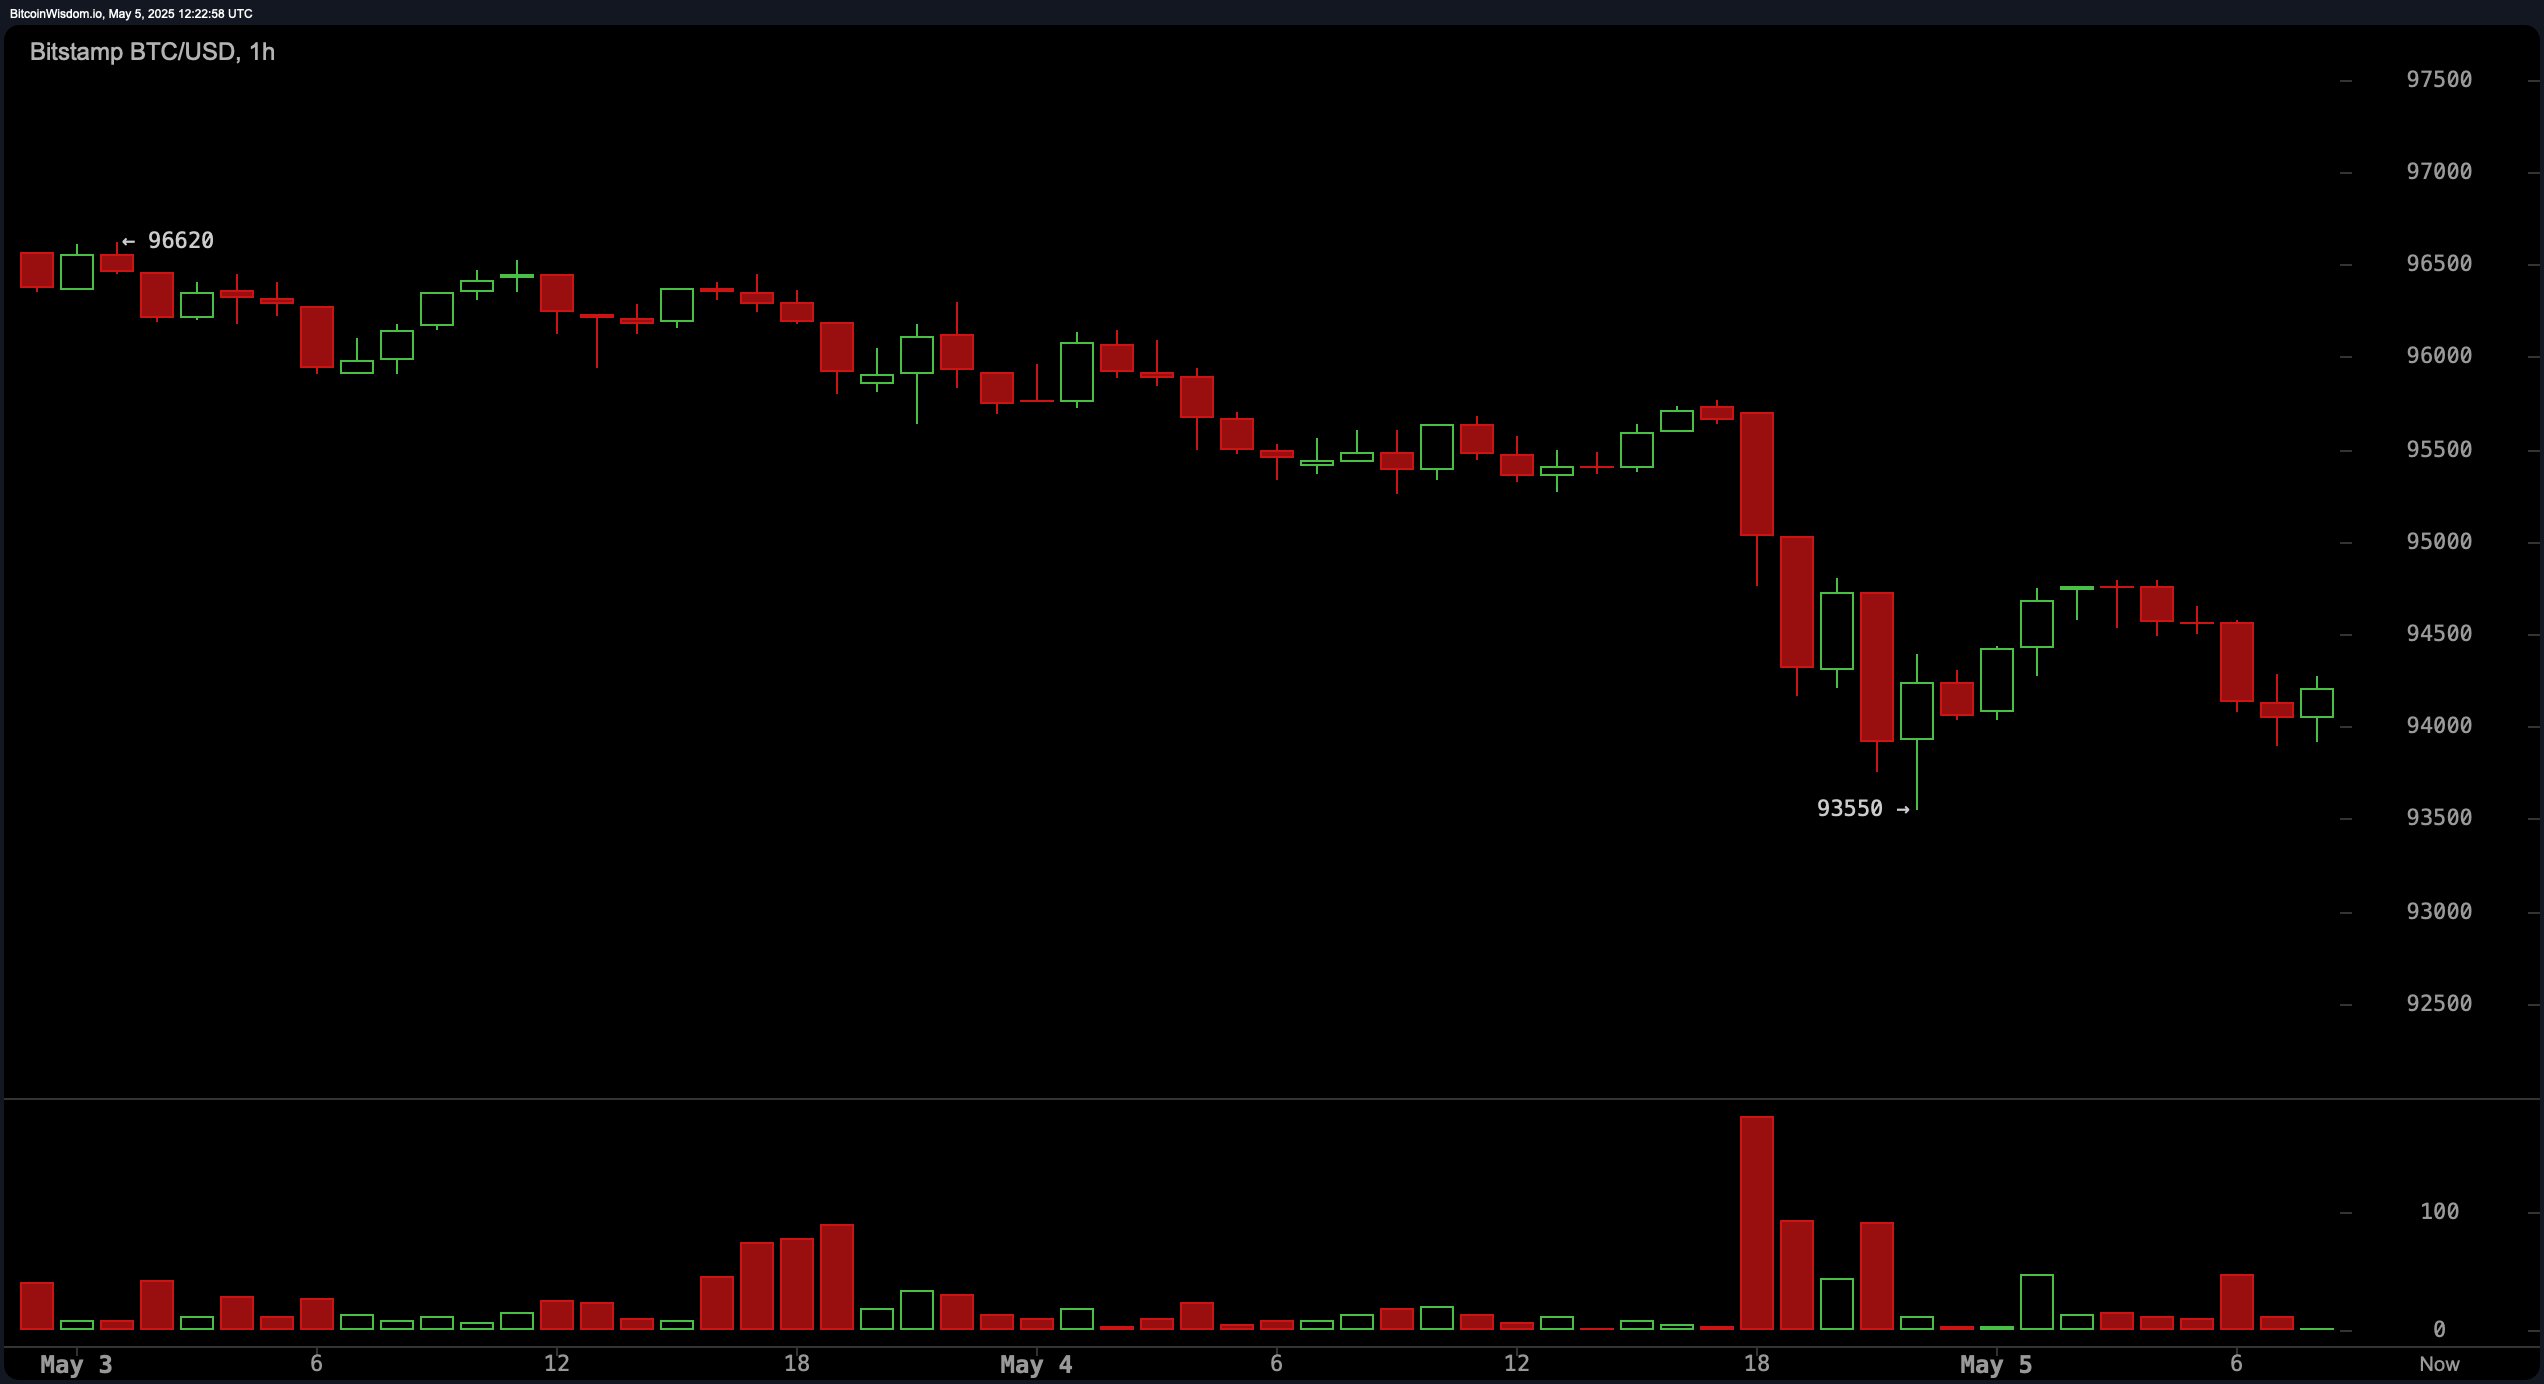
BTC/USD 1H chart via Bitstamp on May 5, 2025.
From the 4-hour chart perspective, the trend remains under pressure, evidenced by a microstructure forming successive lower highs and lows post-top. The key short-term support sits at $92,846, which, if breached, may lead to accelerated selling towards the $90,000 level. Resistance is firmly established between $96,500 and $97,000, a zone that has repeatedly rejected bullish attempts. Notably, increased bearish volume from May 4 to May 5 points toward institutional or panic-driven liquidation, reinforcing the short-term downtrend.
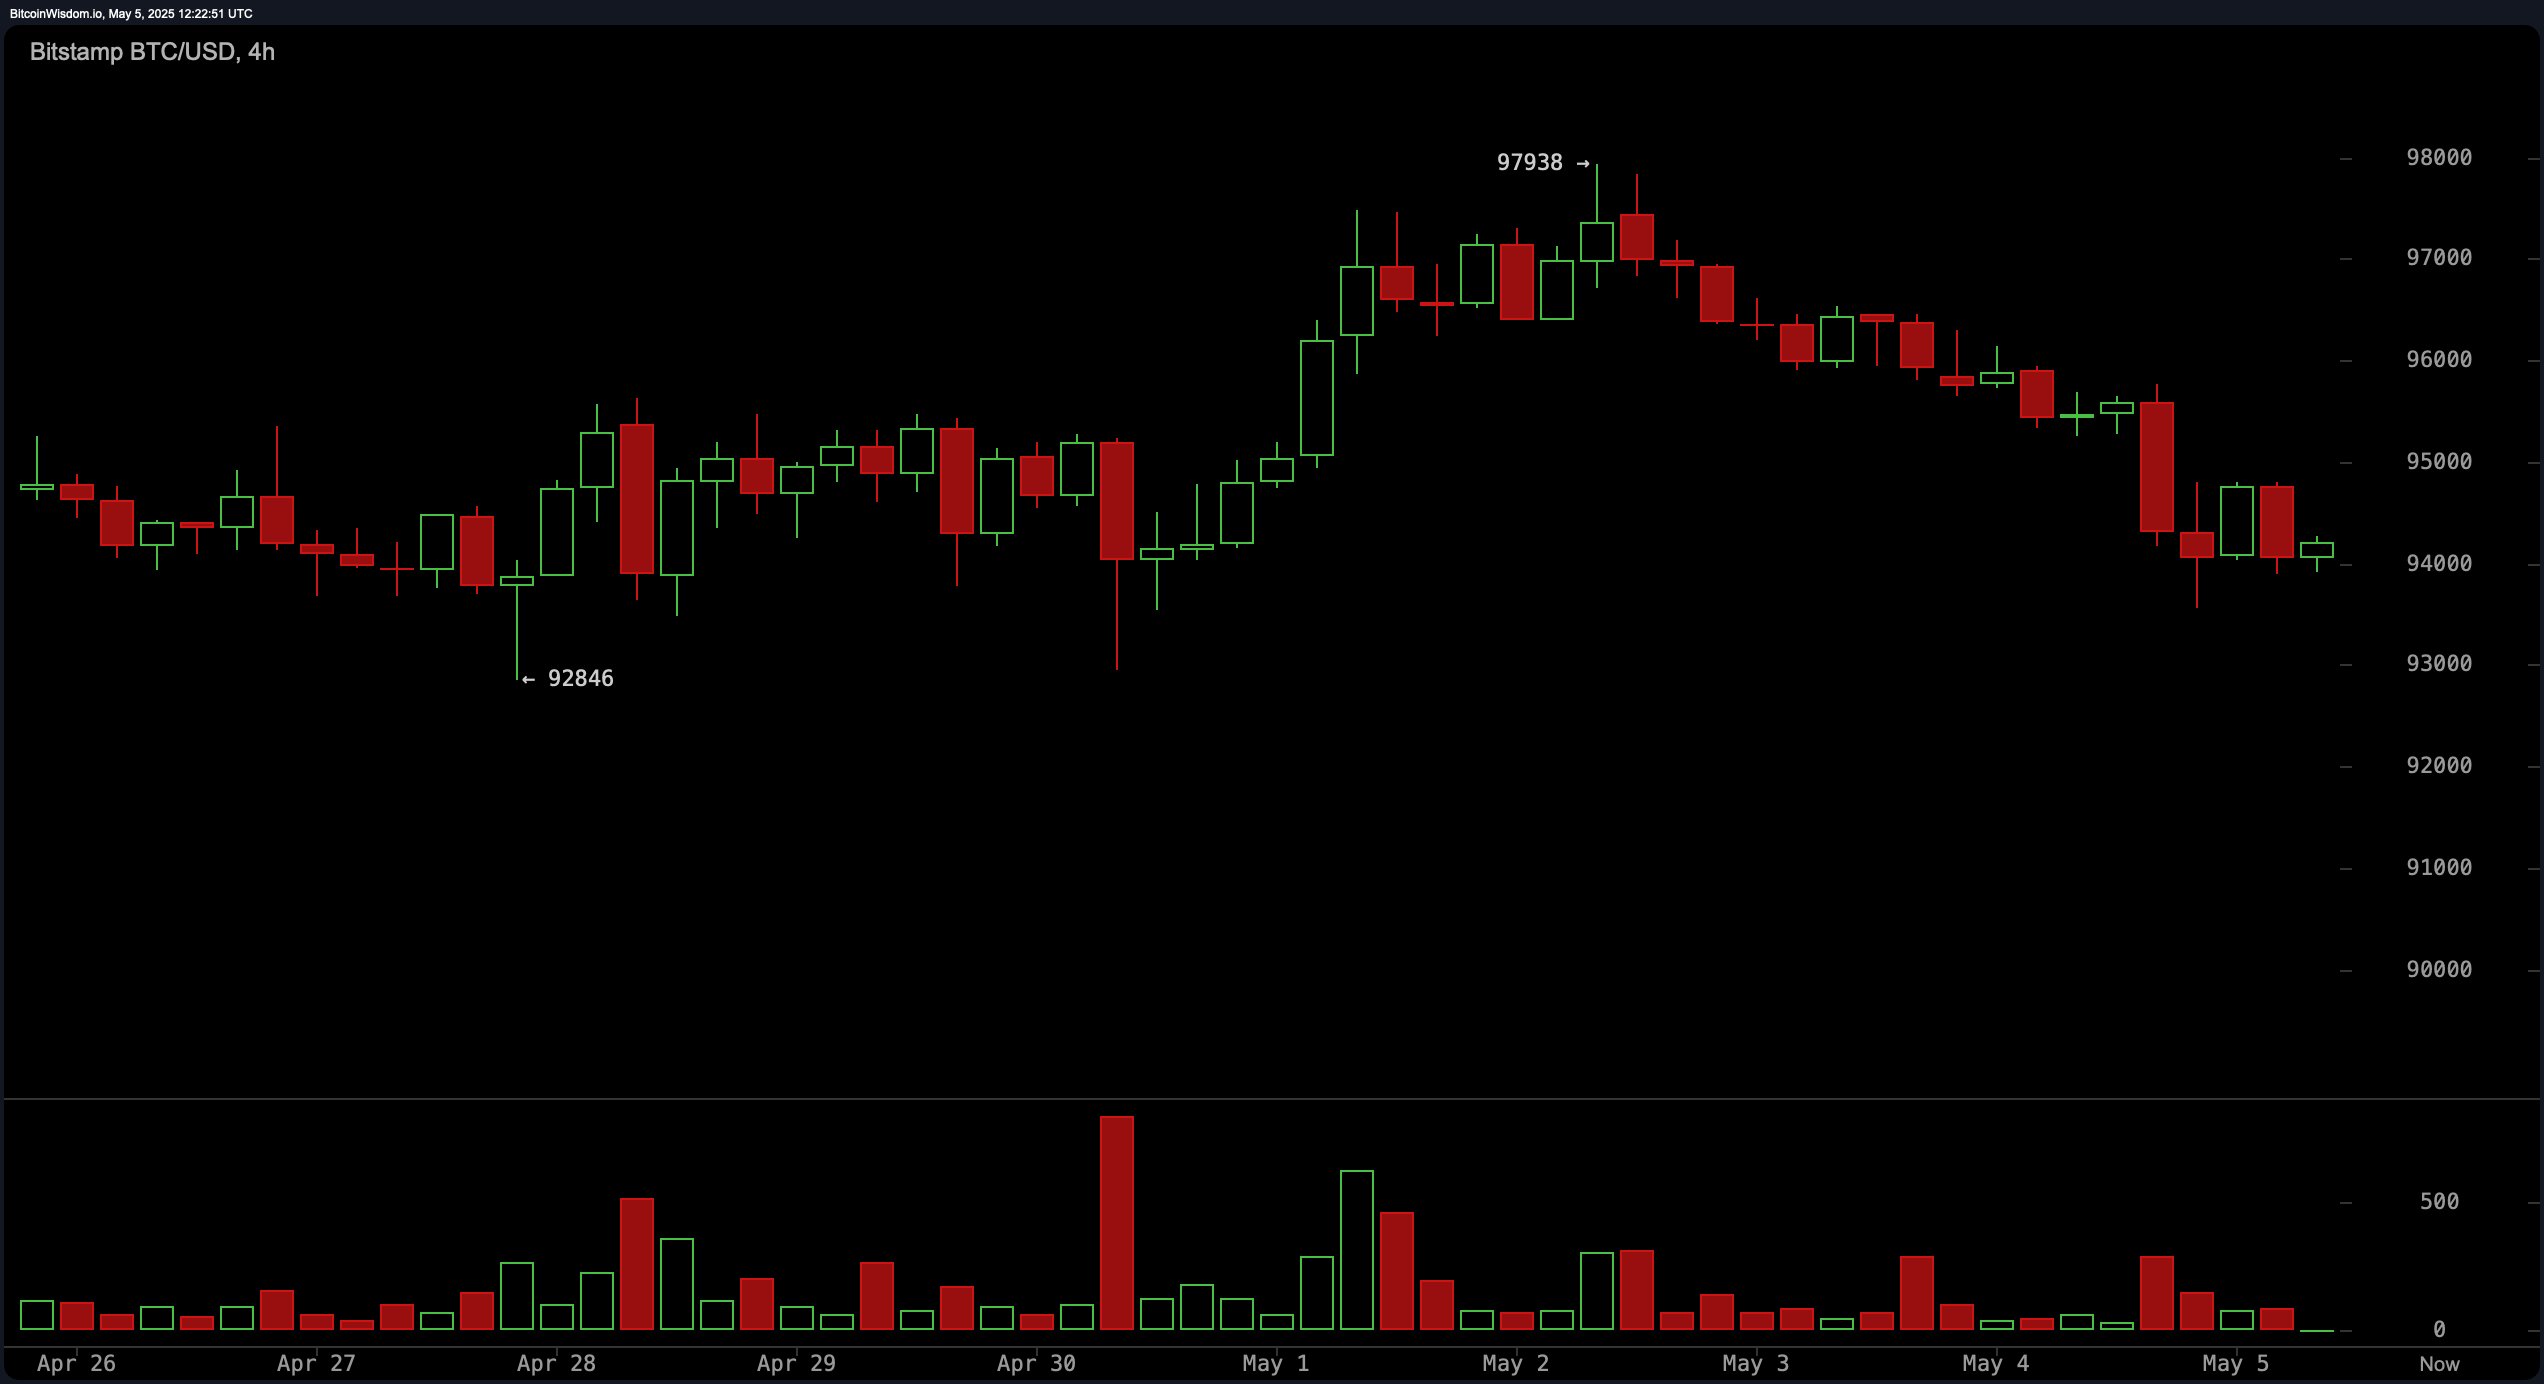
BTC/USD 4H chart via Bitstamp on May 5, 2025.
On the daily timeframe, bitcoin appears to be undergoing a near-term correction after failing to sustain momentum above the $97,000 region. The recent rejection from a high of $97,938 and consecutive red candles suggest waning bullish strength. Volume dynamics further reinforce this view, with green days showing declining volume and red days accompanied by heavier trading—an indicator of distribution and potential exhaustion. The support range between $93,000 and $94,000 is pivotal; a breakdown below this region could deepen the retracement.
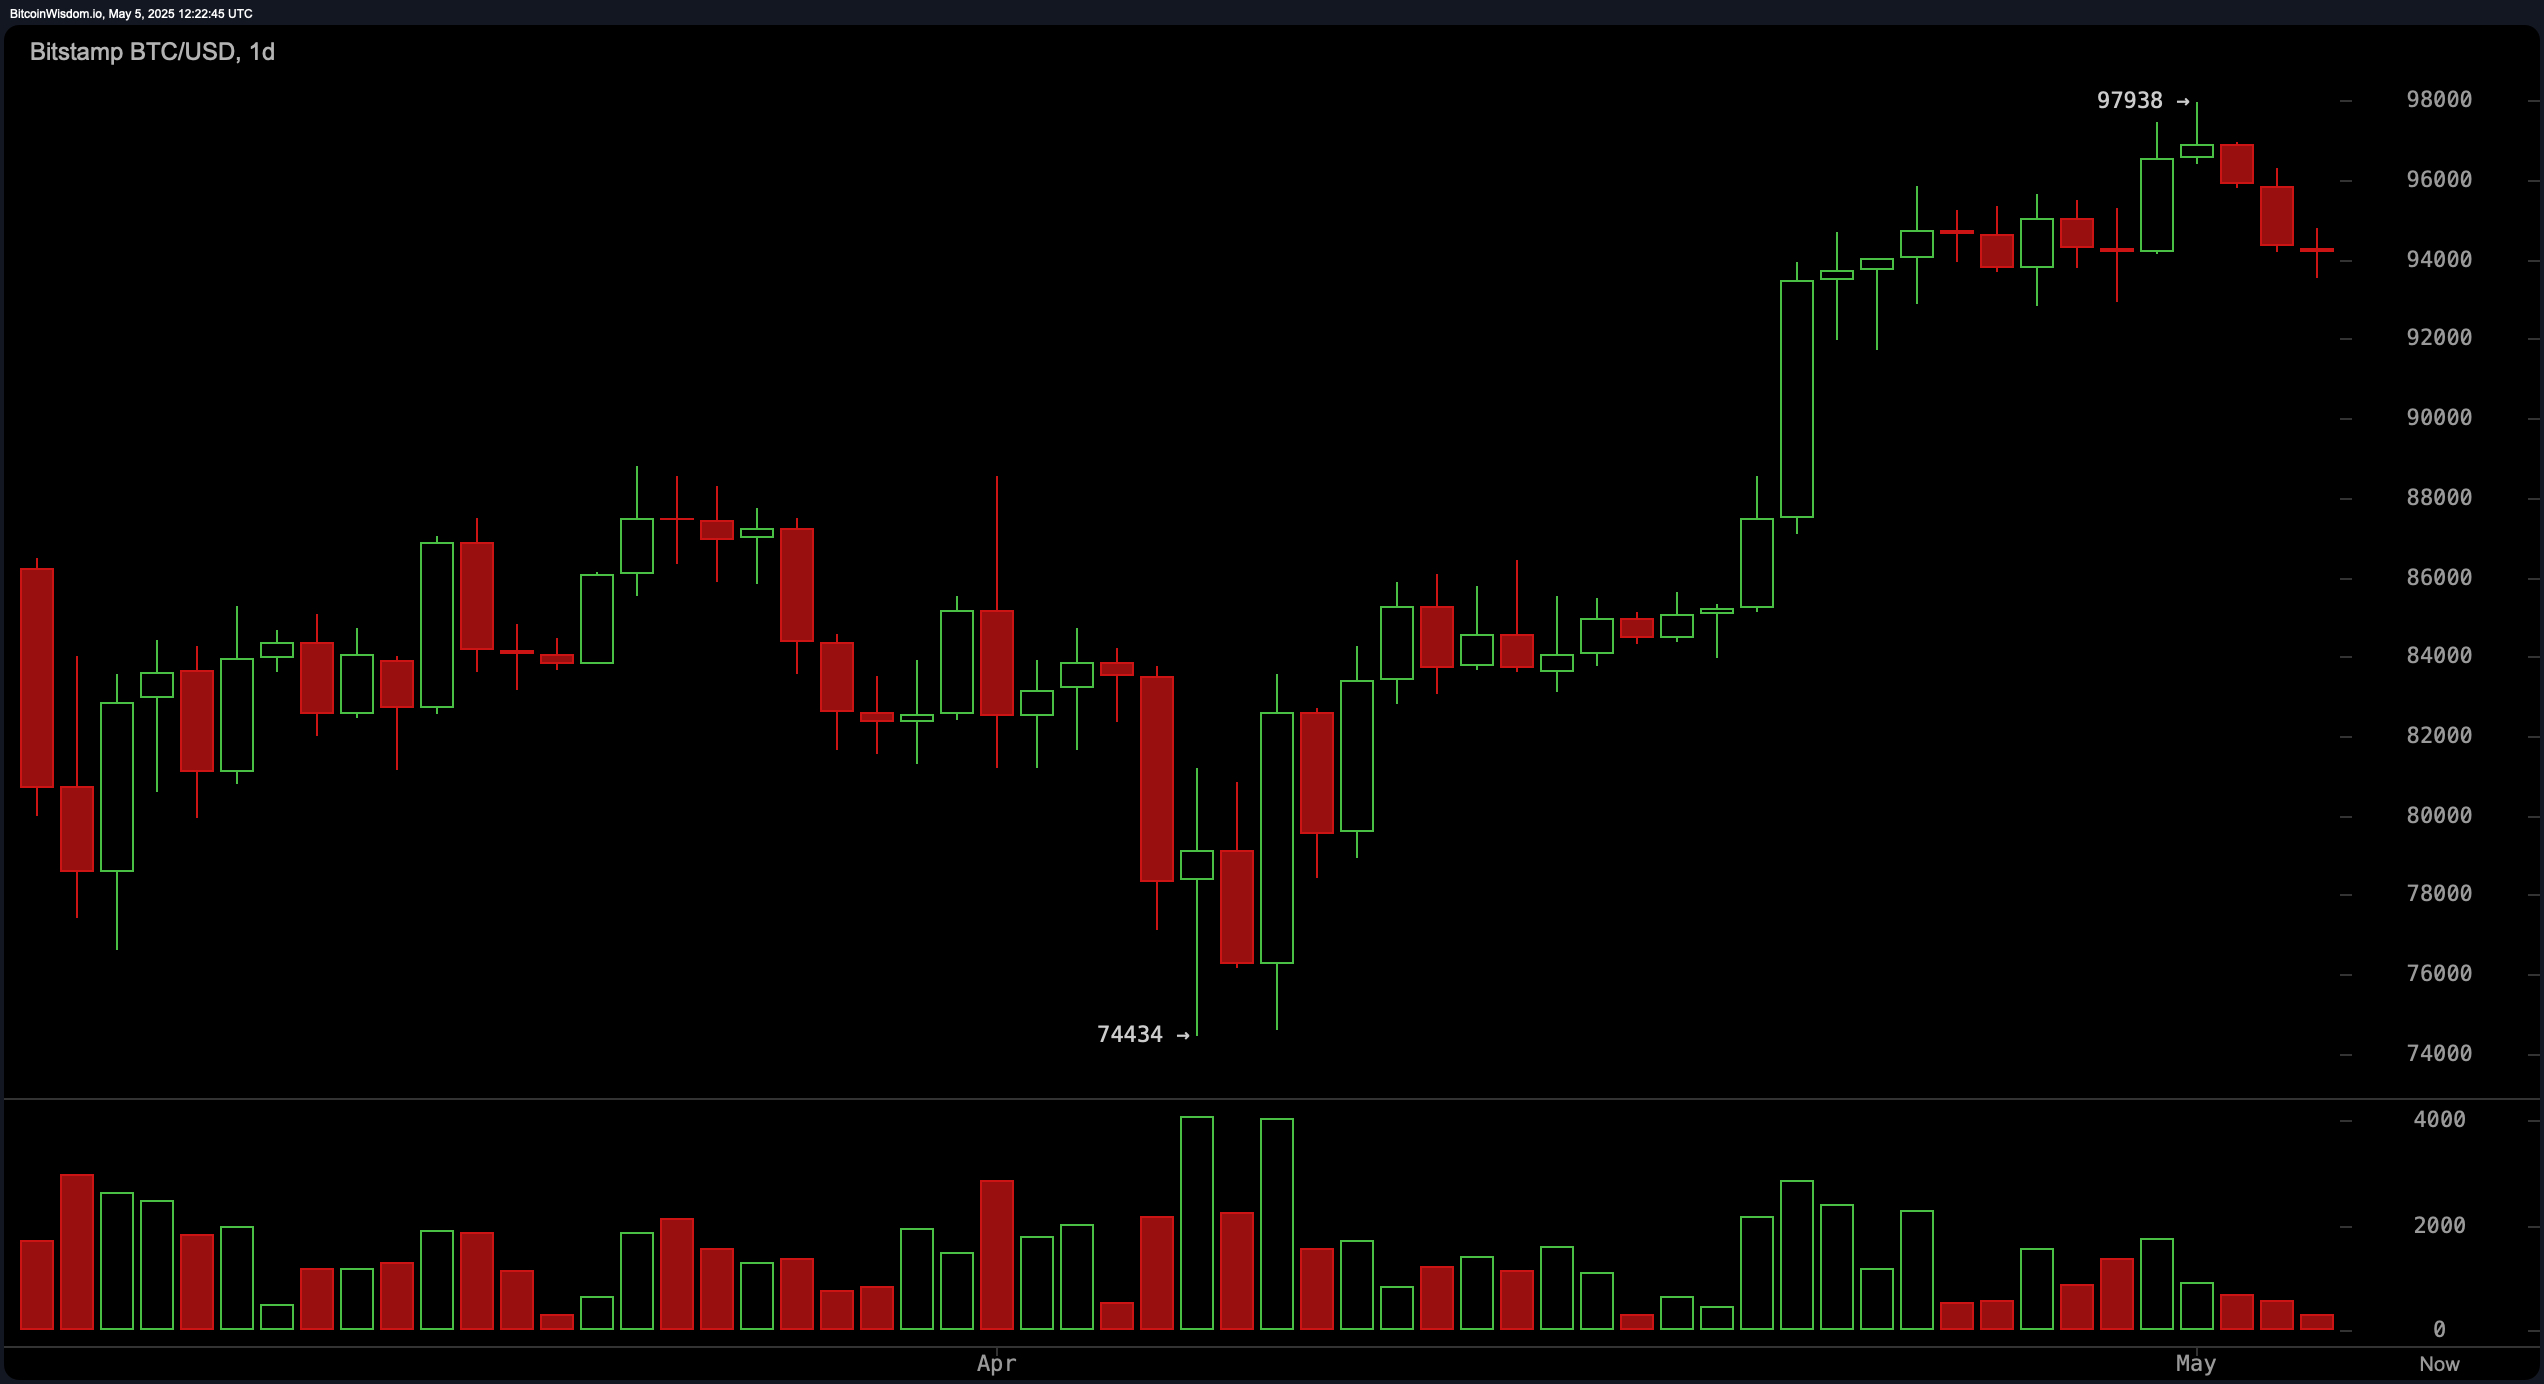
BTC/USD 1D chart via Bitstamp on May 5, 2025.
Momentum indicators are largely neutral, signaling indecision but leaning bearish. The relative strength index (RSI) at 60, Stochastic at 74, and the commodity channel index (CCI) at 42 all remain in neutral territory. The average directional index (ADX) at 30 also suggests a non-trending environment. The Awesome oscillator at 8,029 remains neutral, while the momentum indicator at −525 has turned bearish. The moving average convergence divergence (MACD) level at 2,748 is the lone bullish oscillator, pointing to some residual buying strength.
Moving averages (MAs) present a mixed but slightly bullish picture on broader timeframes. Short-term averages such as the 10-period exponential moving average (EMA) and simple moving average (SMA) indicate bearish signals at 94,352 and 94,984, respectively. However, all moving averages beyond the 20-period—both exponential and simple—are issuing bullish signals, with the 200-period exponential moving average at 86,298 and the 200-period simple moving average at 90,411 supporting the case for long-term bullish structure. This divergence underscores the ongoing conflict between short-term bearish momentum and a longer-term uptrend foundation.
Bull Verdict:
If bitcoin successfully holds the $93,000–$94,000 support zone and reclaims the $95,000 level on strong volume, this would signal the exhaustion of the recent correction and open the path for a retest of the $96,500–$97,000 resistance band. With longer-term moving averages aligned in favor of bulls and the MACD showing buying pressure, a renewed uptrend could develop, targeting $98,000 and beyond.
Bear Verdict:
Should bitcoin break below the $92,846 threshold with volume confirmation, the bearish momentum is likely to accelerate, pushing price toward $91,000 or even $90,000. Given the short-term weakness across all charts and bearish signals from oscillators such as momentum and the Awesome oscillator, the prevailing trend favors further downside unless key levels are swiftly reclaimed.
[ad_2]