
[ad_1]
1- Bitcoin January 2025: Outlook of BTC Struggles
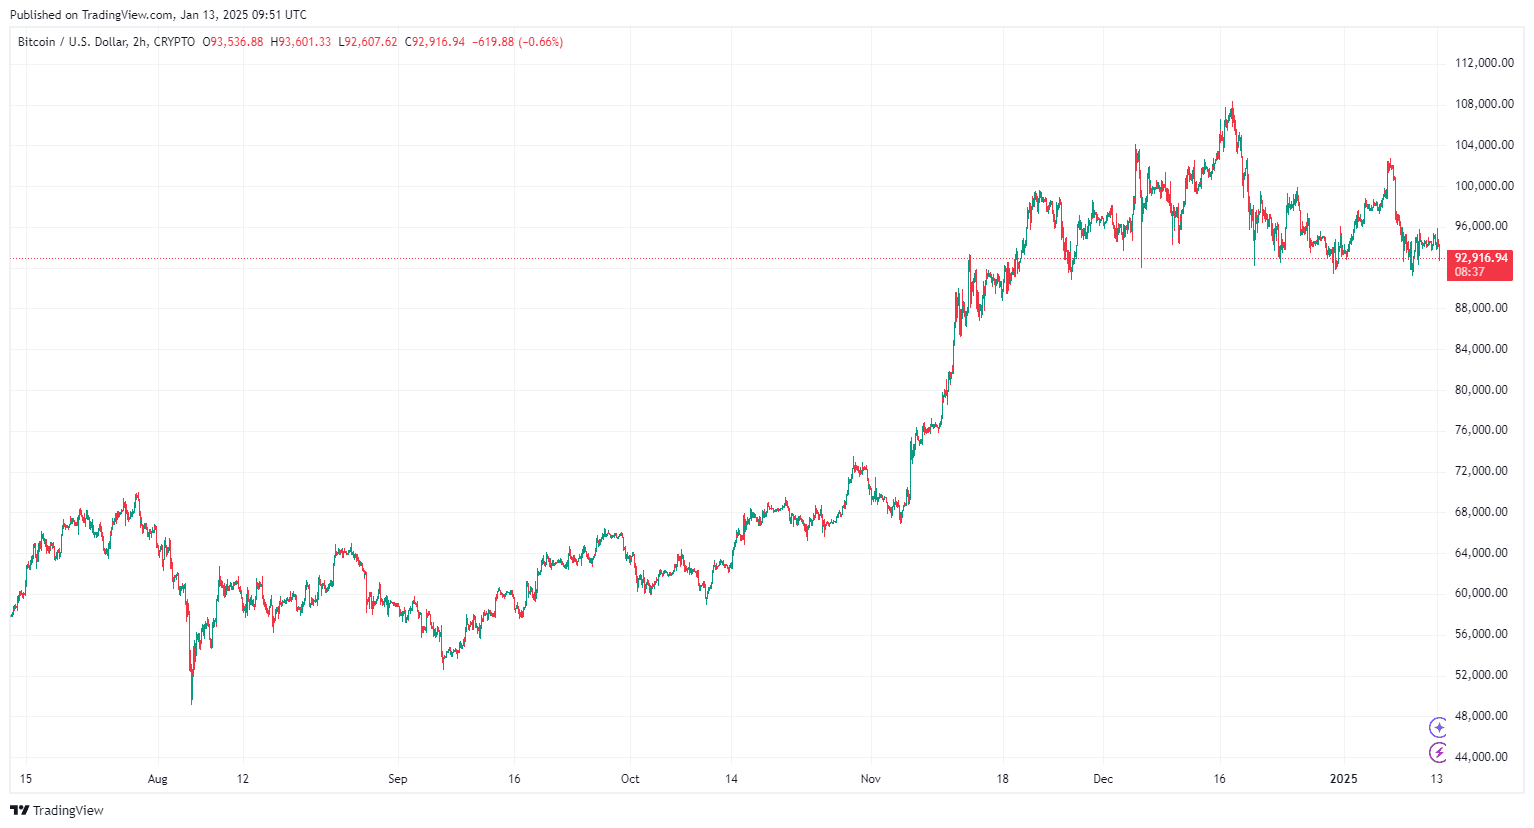
A closer look at Bitcoin January 2025 performance to date shows that Bitcoin price momentum has taken a bearish turn, as BTC struggles to maintain key support levels. Bitcoin’s near-term trajectory remains uncertain with reduced network activity, declining capital inflows, and macroeconomic pressures weighing on the market. But to better understand what might be ahead, a deeper look into BTC levels and indicators is required for an accurate Bitcoin price analysis combined with key insights on the market, which would ultimately shed light on this week’s Bitcoin price prediction.
By TradingView – BTCUSD_2025-01-13 (1M)
2- Bitcoin Price Analysis: BTC Levels and Indicators
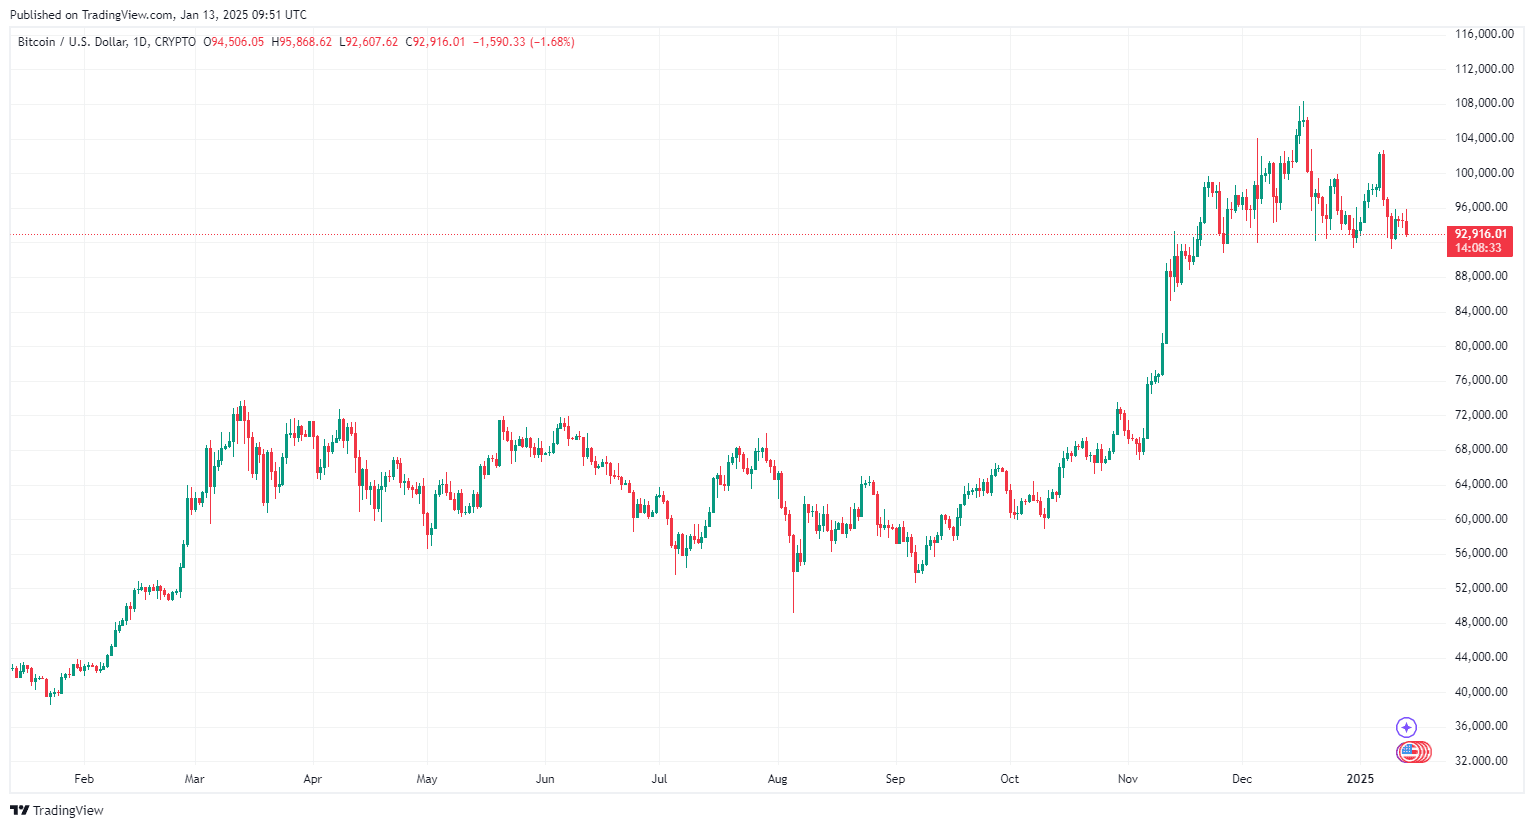
Current Bitcoin Performance and Market Data
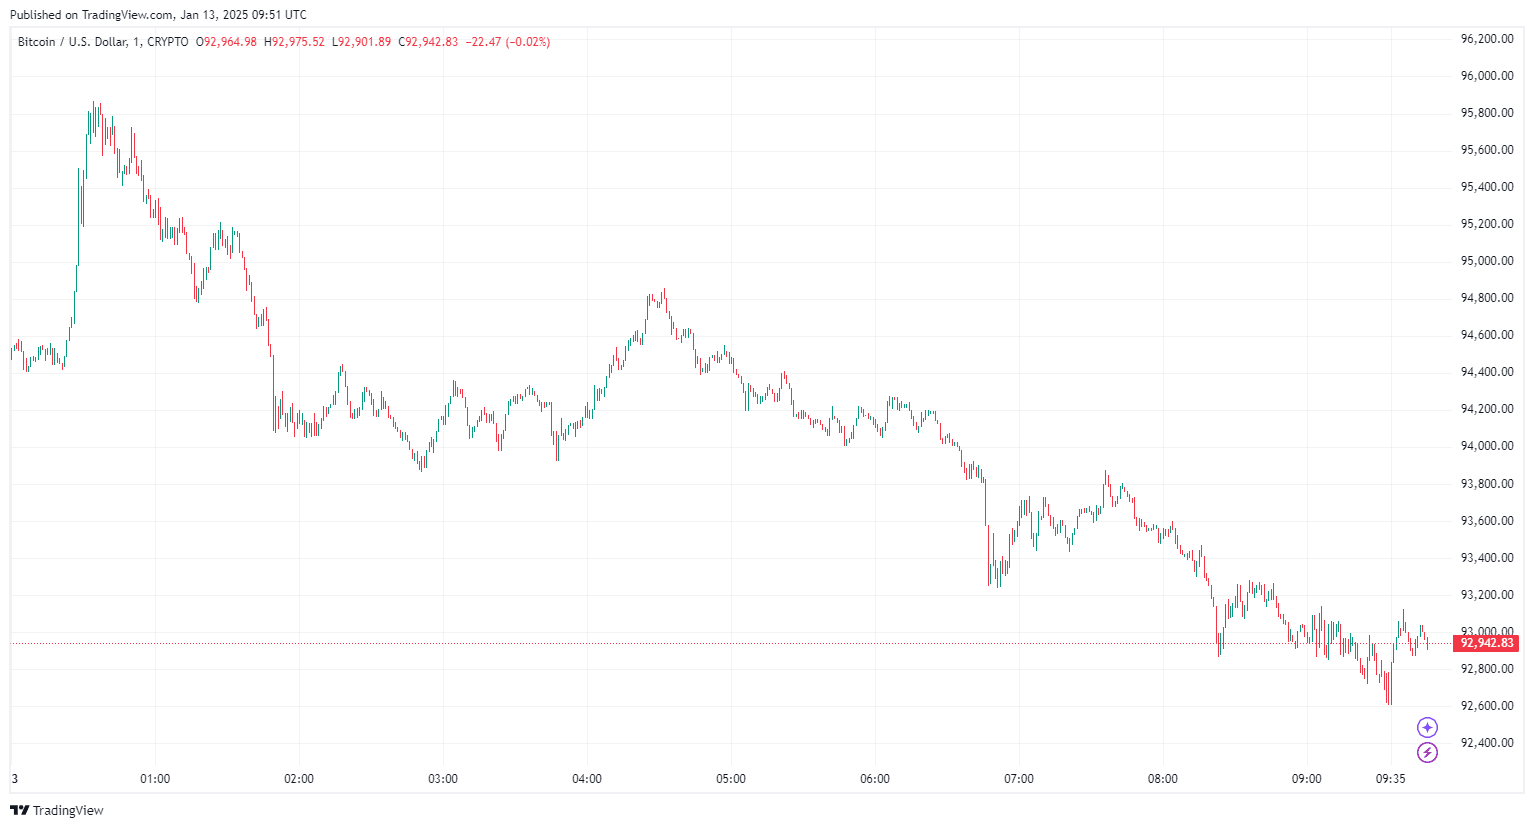
- BTC Price: $93,034.76
- Market Cap: $1.84 trillion
- Circulating Supply: 19.8 million BTC
- 24h Trading Volume: $32.17 billion
-
Intraday Range:
- Low: $92,736.77
- High: $95,837.00
-
Performance:
- 1-Day: -1.00%
- 5-Day: -5.53%
- 1-Month: -8.41%
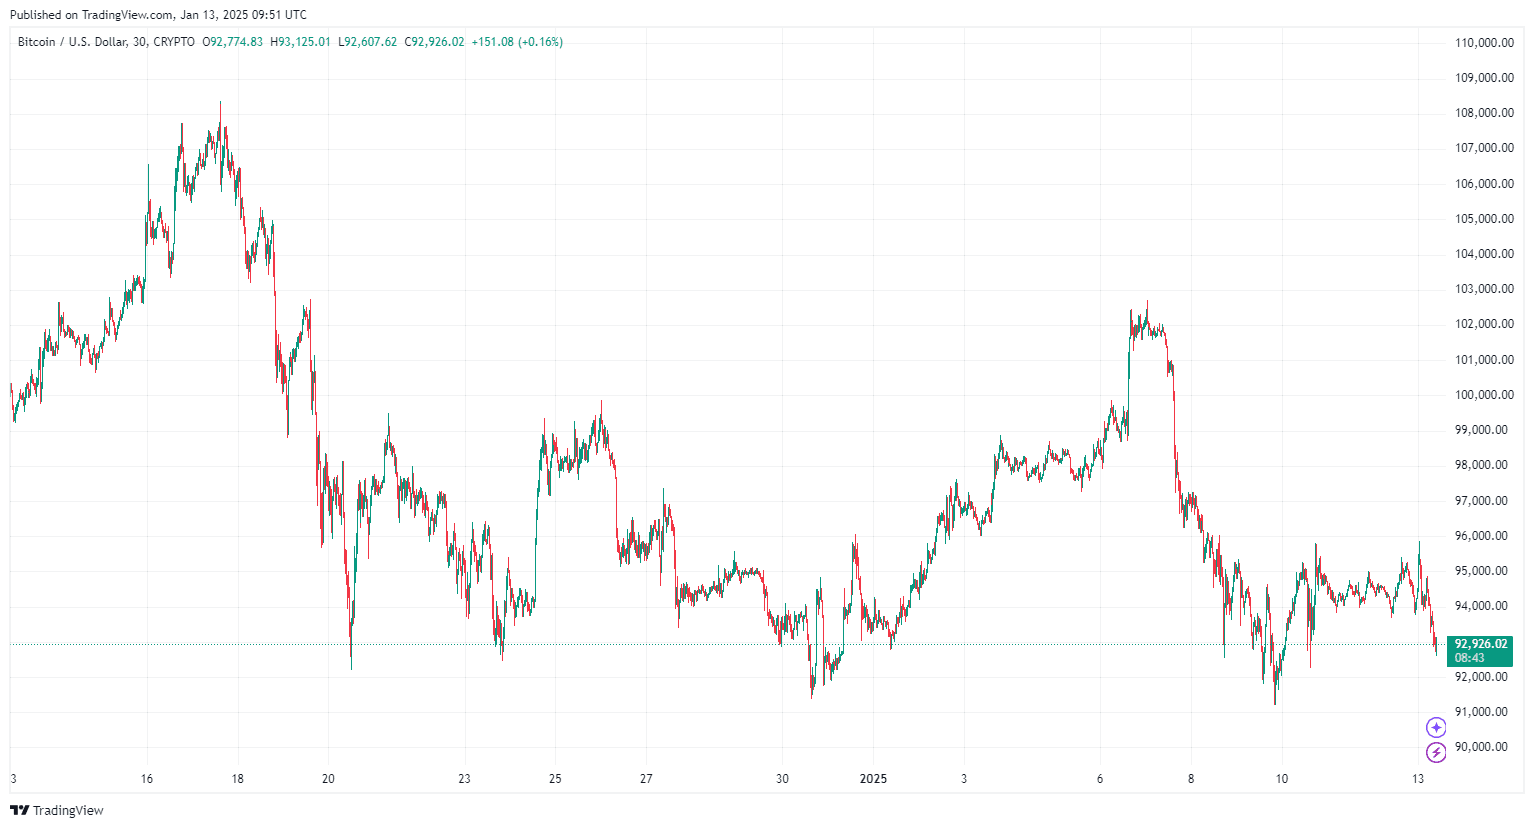
By TradingView – BTCUSD_2025-01-13 (1D)
Bitcoin’s price drop below $94,000 marks a continuation of its bearish trend, influenced by weak network activity and reduced investment interest. The global cryptocurrency market cap has also declined by 2.19%, standing at $3.22 trillion.
Technical Indicators and Support Levels
Technical indicators from TradingView reflect bearish sentiment for Bitcoin:
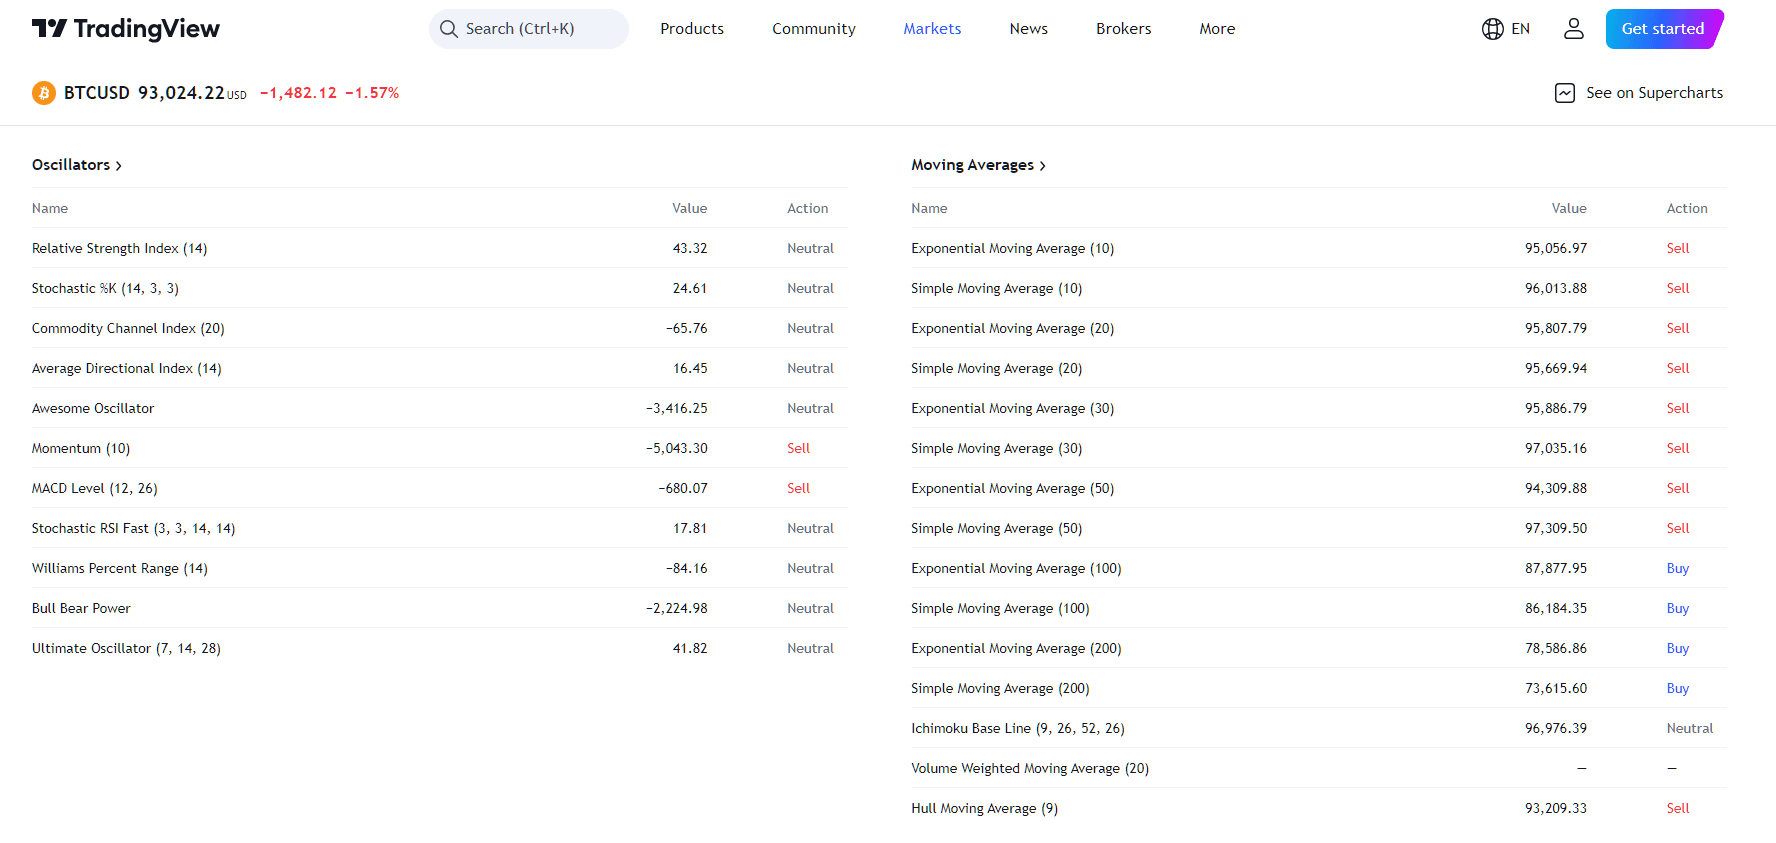
By TradingView – BTCUSD_2025-01-13 Technical Indicators
- Oscillators: Momentum (-5,043.30) and MACD Level (-680.07) signal a sell trend.
- Moving Averages: Most moving averages (e.g., EMA 10, SMA 50) also show sell signals.
Key support and resistance levels to watch this week:
- Support: $90,000, $87,500
- Resistance: $94,500, $96,000, $97,000
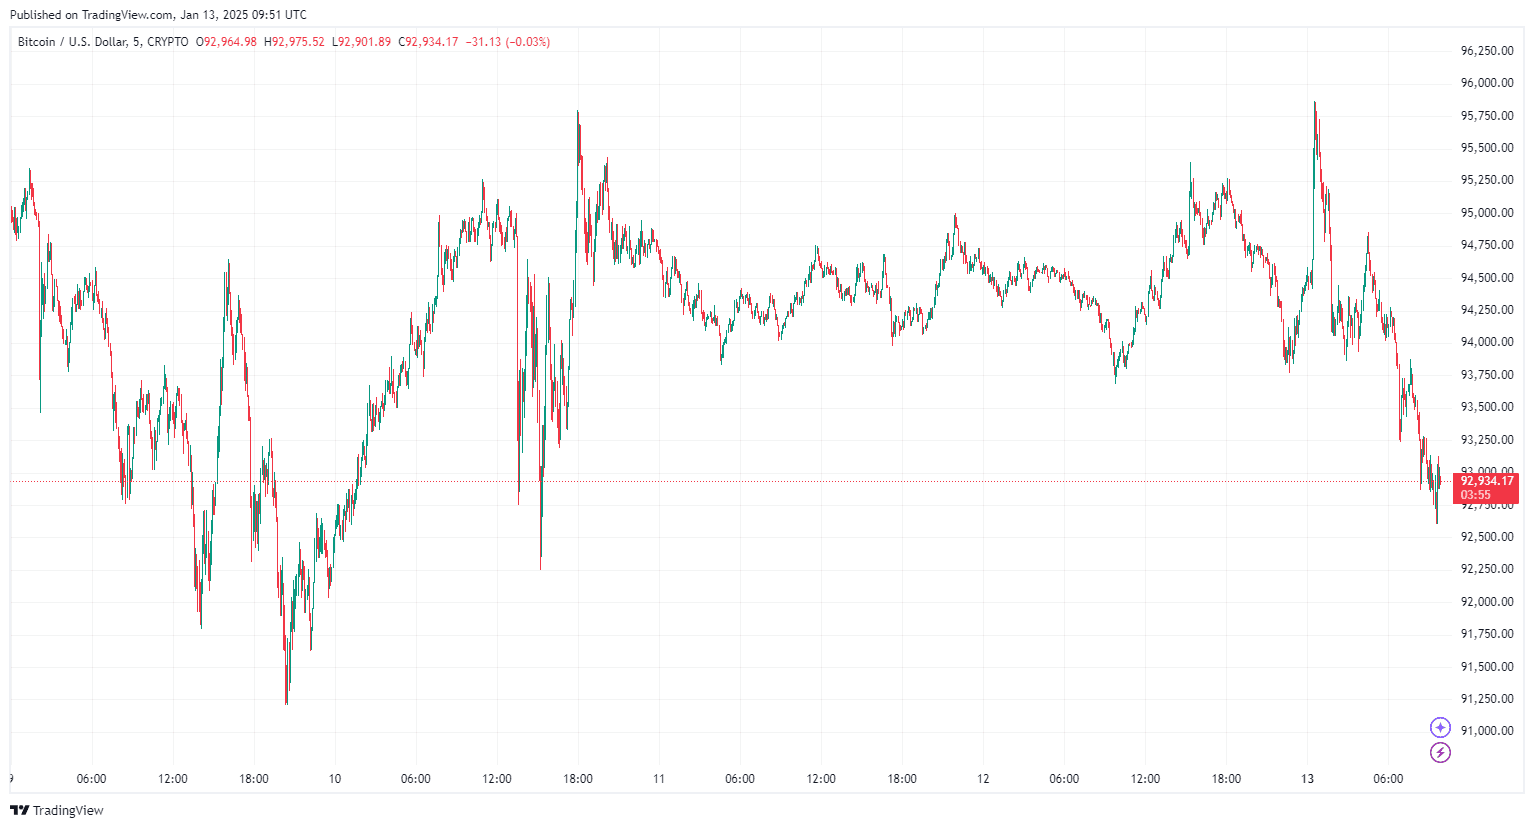
By TradingView – BTCUSD_2025-01-13 (5D)
3- Key Insights from Bitcoin Network Activity
Recent posts from crypto analyst Ali Martinez on X highlight concerning metrics for Bitcoin:
Large Transactions Decline:
- Large transactions on the Bitcoin network have dropped by 51.64% in the past month, from 33,450 to 16,180. This signals a significant reduction in whale activity.
Falling Active Addresses:
- Bitcoin network activity is at its lowest since November 2024, with only 667,100 active addresses.
Reduced Capital Inflows:
- Capital inflows into the cryptocurrency market have plummeted by 56.70%, from $134 billion to $58 billion. This indicates a sharp decline in investment interest.
Critical Resistance Zone:
- Bitcoin faces a key resistance zone between $97,000 and $99,500, where 1.26 million addresses previously accumulated 1.22 million BTC. Breaking this level could be pivotal for a bullish reversal.
4- Bitcoin Price Prediction for This Week
Bitcoin’s performance this week will depend heavily on its ability to hold the $90,000 support level and break through immediate resistance zones. Here are the scenarios:
Bitcoin Bearish Scenario:
- If BTC fails to hold $90,000, it could test lower levels around $87,500. Weak network activity and reduced investment inflows could exacerbate the decline.
Bitcoin Bullish Scenario:
- A rebound above $94,500 may drive BTC toward $96,000–$97,000. Breaking through the $97,000–$99,500 resistance zone would require strong buying momentum, currently absent.
Bitcoin Likely Range:
- BTC is expected to trade between $91,000 and $94,000, reflecting a range-bound movement driven by cautious market sentiment.
By TradingView – BTCUSD_2025-01-13 (6M)
Will BTC Price crash below $90,000 this Week?
Bitcoin price action remains under pressure as bearish factors weigh on market dynamics. While the long-term outlook for Bitcoin in 2025 remains bullish, short-term indicators suggest a cautious approach for traders. The $90,000 support level will be critical this week, with any breach potentially leading to significant downside.
By TradingView – BTCUSD_2025-01-13 (1Y)
[ad_2]