
[ad_1]
Bitcoin’s price on July 3, 2024, stands at $60,177, with a 24-hour intraday range from $59,712 to $62,974. The trading volume over the past 24 hours reached $24.36 billion, and the market capitalization is currently at $1.18 trillion. Analyzing various time frames and technical indicators reveals consistent bearish signals, suggesting caution for traders. Conversely, the decline completed a CME gap on the futures chart, suggesting a potential upward movement may be forthcoming.
Bitcoin
Bitcoin’s 1-hour chart highlights a downtrend from $63,211 to $59,544, demonstrating strong bearish pressure indicated by increased selling volume near the lows. Key support is noted at $59,544, with resistance around $63,211. Traders are advised to consider short positions on pullbacks near resistance and exit near support levels.
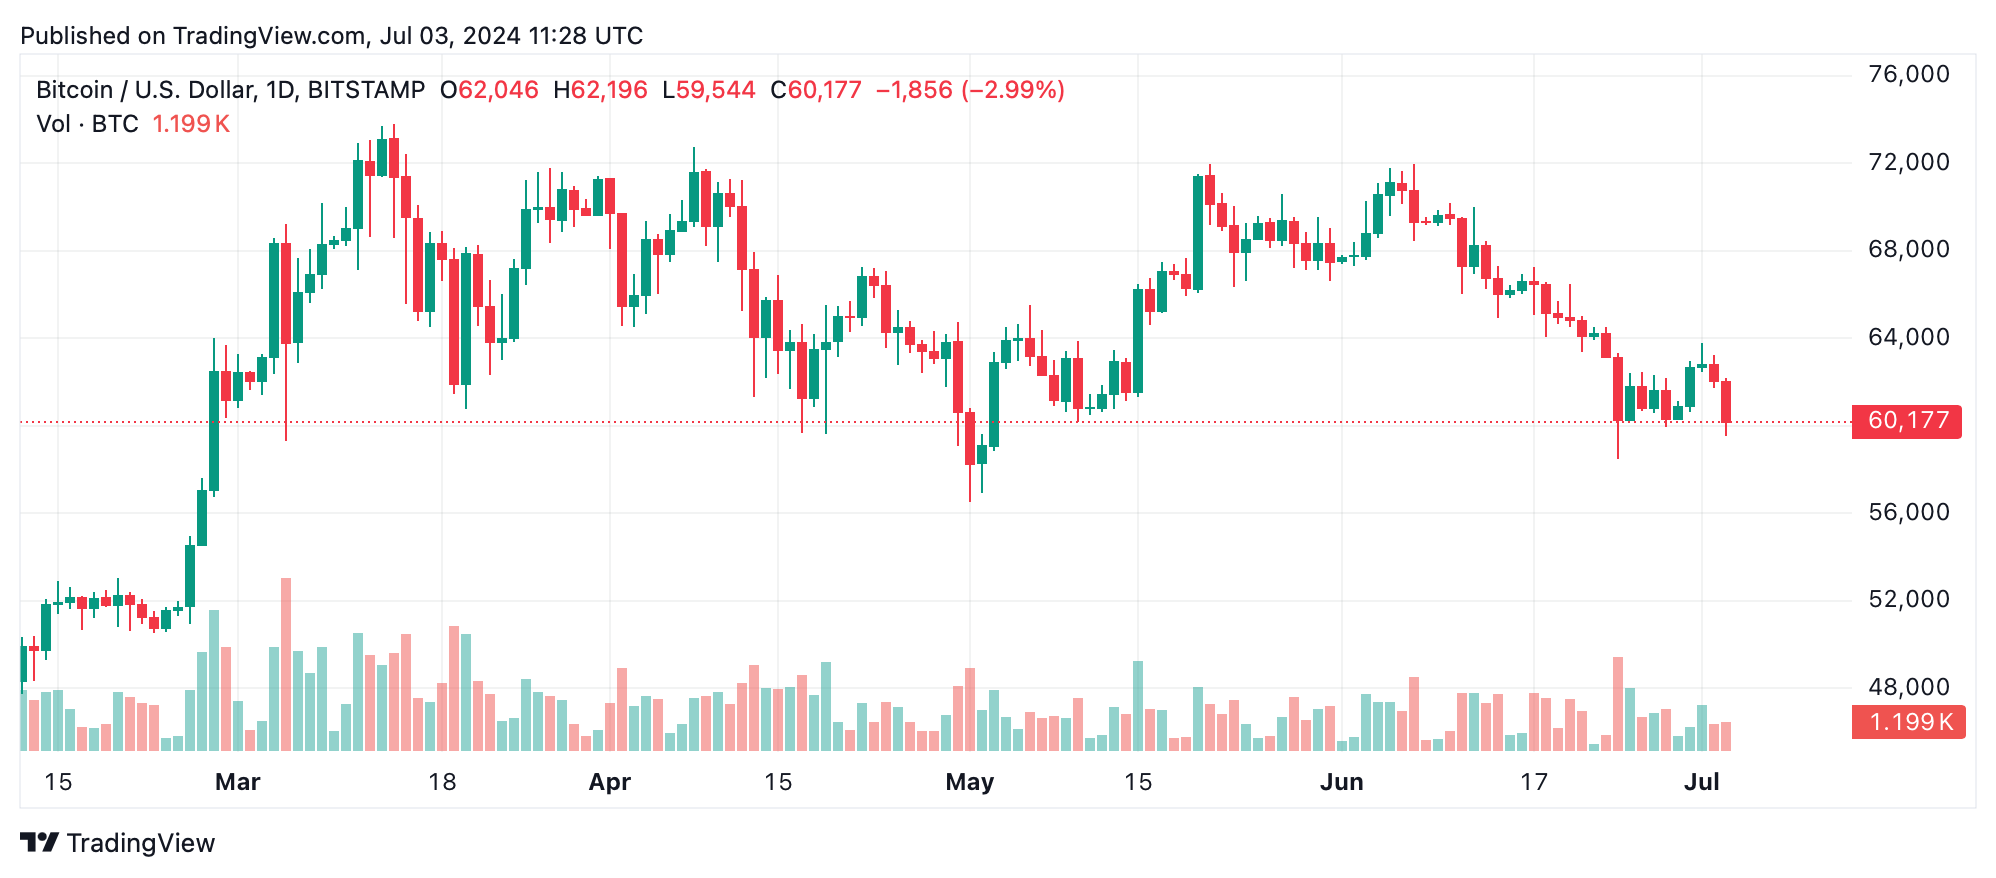
BTC/USD daily chart via Bitstamp on July 3, 2024.
The 4-hour chart presents an extended downtrend from $63,794 to $59,544, supported by volume spikes during bearish moves. Key levels align with the 1-hour chart, with support at $59,544 and resistance at $63,794. Consecutive downturns with minor bullish corrections reinforce the bearish momentum.
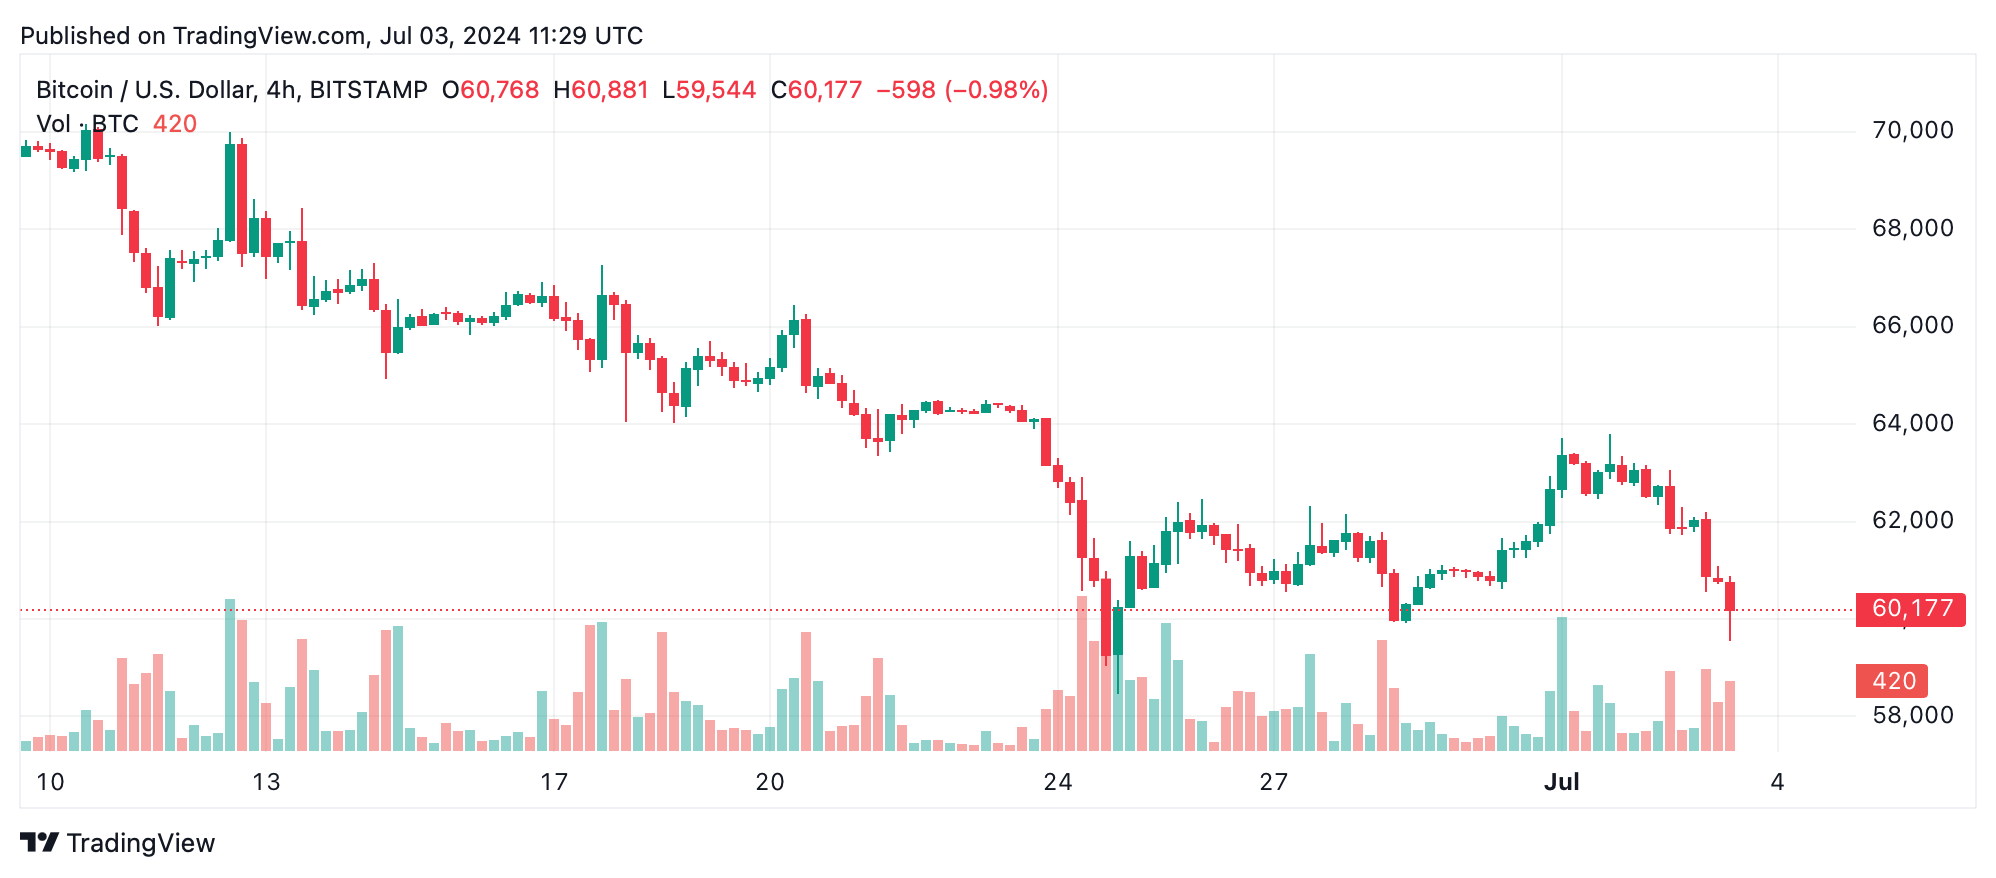
BTC/USD 4-hour chart via Bitstamp on July 3, 2024.
Daily chart analysis shows a significant downtrend from $71,949 to $58,456, with increased volume on downward moves indicating seller dominance. Key support lies at $58,456, with resistance at $71,949. Larger downturns with intermittent upswings suggest persistent downtrend conditions.
Oscillator readings offer mixed signals. The relative strength index (RSI) at 36 and the Stochastic at 39 indicate neutrality, while the commodity channel index (CCI) at -97 and the average directional index (ADX) at 33 also suggest no clear trend. However, the momentum at -3114 and the moving average convergence divergence (MACD) level at -1549 provide sell signals, aligning with the overall bearish sentiment from the charts.
Moving averages (MAs) further confirm the bearish outlook. The Exponential Moving Averages (EMAs) and Simple Moving Averages (SMAs) across 10, 20, 30, 50, and 100 periods all signal bearish action, except for the 200-period EMA and SMA, which indicate bullish sentiment. The EMA (10) is at $61,900 and the SMA (10) is at $61,324, both below the current price, suggesting further downside potential. The EMA (200) at $58,252 and SMA (200) at $58,402 hint at possible long-term support.
Bear Verdict:
The prevailing bearish indicators, including the downward trends in multiple time frames, volume spikes during bearish moves, and sell signals from key oscillators and moving averages, suggest continued downward pressure on bitcoin’s price. Traders should favor short positions and remain cautious until stronger bullish signals emerge.
Bull Verdict:
Despite the overall bearish sentiment, the 200-period EMA and SMA signaling a buy and potential long-term support above $58,000 offer a glimmer of hope. A clear bullish reversal above $60,000 could present opportunities for long positions, but traders should wait for strong confirmation before making bullish moves.
[ad_2]