[ad_1]
Bitcoin’s price has finally corrected after weeks of aggressive rallying. It dropped by around 10% recently, leaving market participants wondering whether a deeper crash should be expected.
Technical Analysis
By TradingRage
The Daily Chart
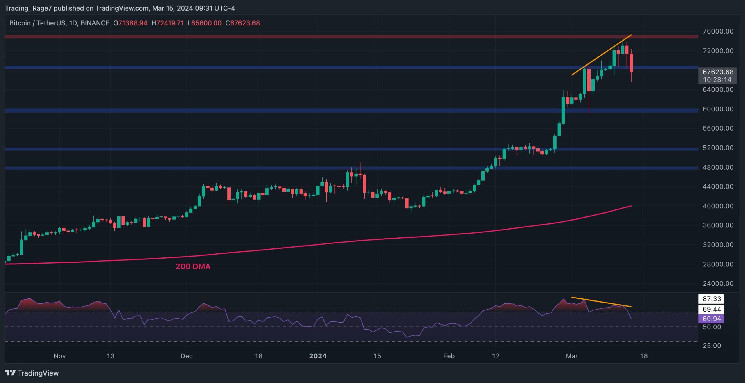
Looking at the daily chart, the price has been rallying over the last few months, consistently making higher highs and lows. Yet, the $75K resistance level rejected Bitcoin lower, and the market is currently dropping below the $68K support level. Yet, there is still a significant support level available around the $60K mark to prevent a crash.
Meanwhile, the Relative Strength Index has been showing a clear bearish divergence lately, indicating that the market is likely to go through a more prolonged correction phase.
The 4-Hour Chart
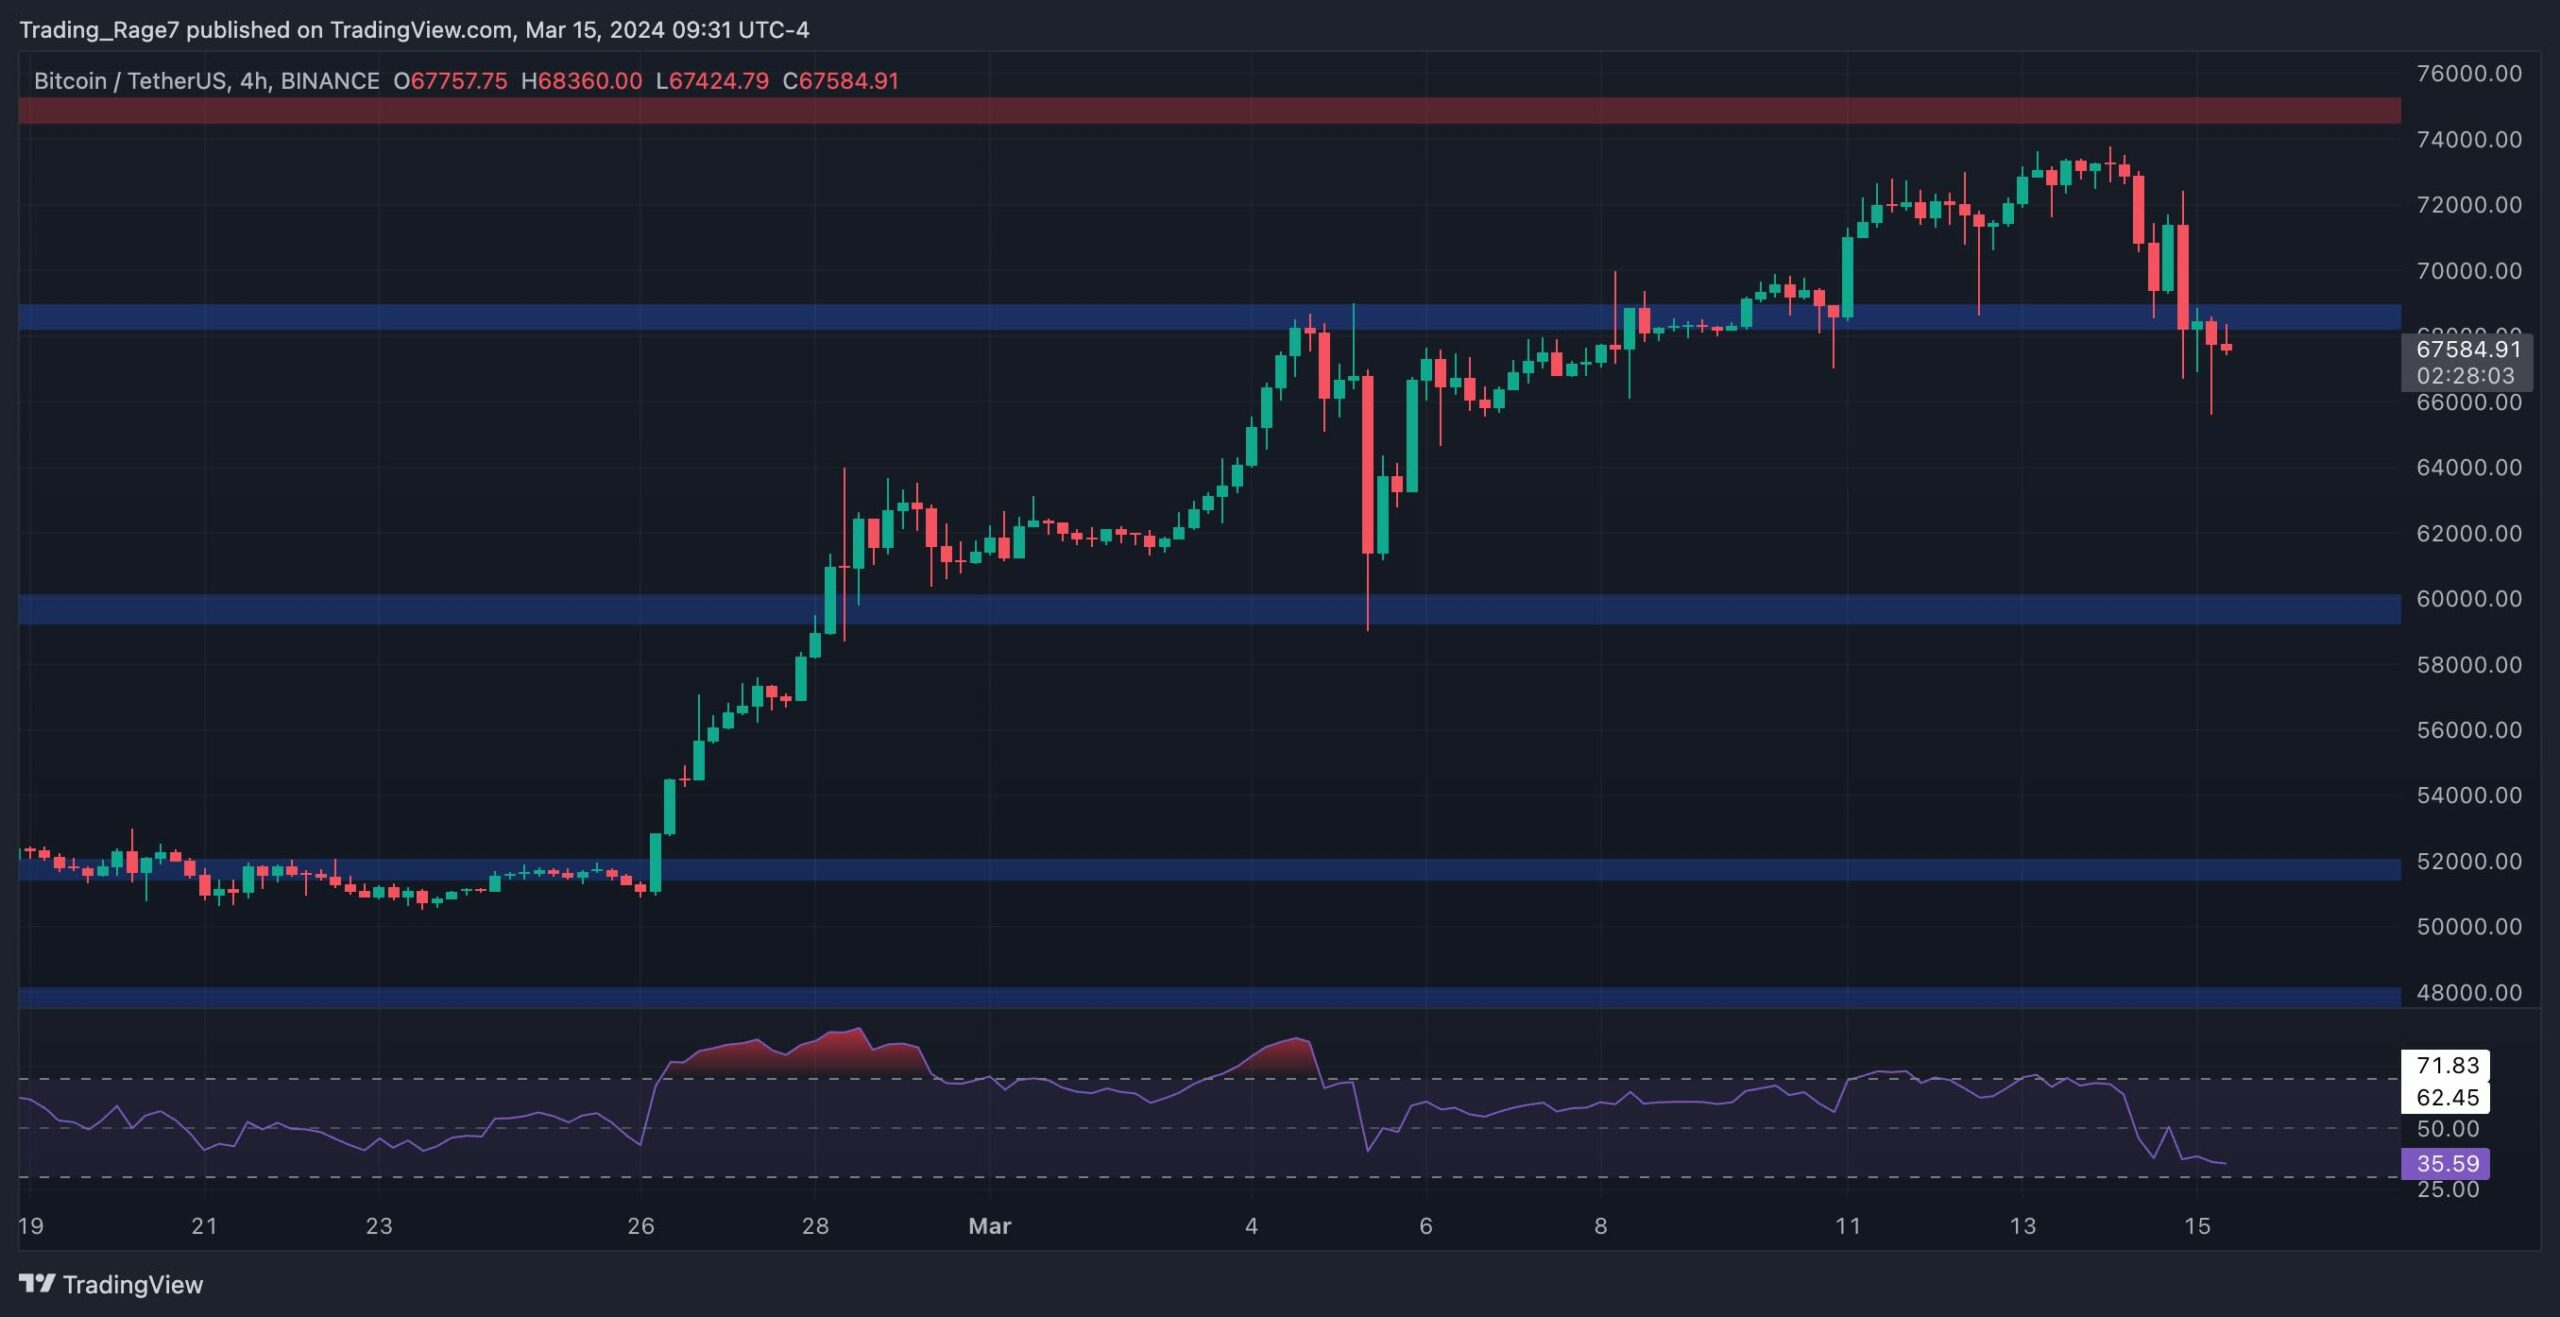
On the 4-hour chart, the price action looks much clearer. The market has made a high below the $75K level and is currently testing the $68K support zone.
A bearish breakout is likely to lead to a further decline toward the $60K level in the short term. The RSI showing values below 50% confirms that the momentum has now switched to bearish, and a further drop seems probable.
On-Chain Analysis
By TradingRage
Bitcoin STH SOPR
While Bitcoin’s price has finally shown some willingness to pull back after making a new all-time high, it might be beneficial to analyze the underlying fundamentals of the network to figure out the reason.
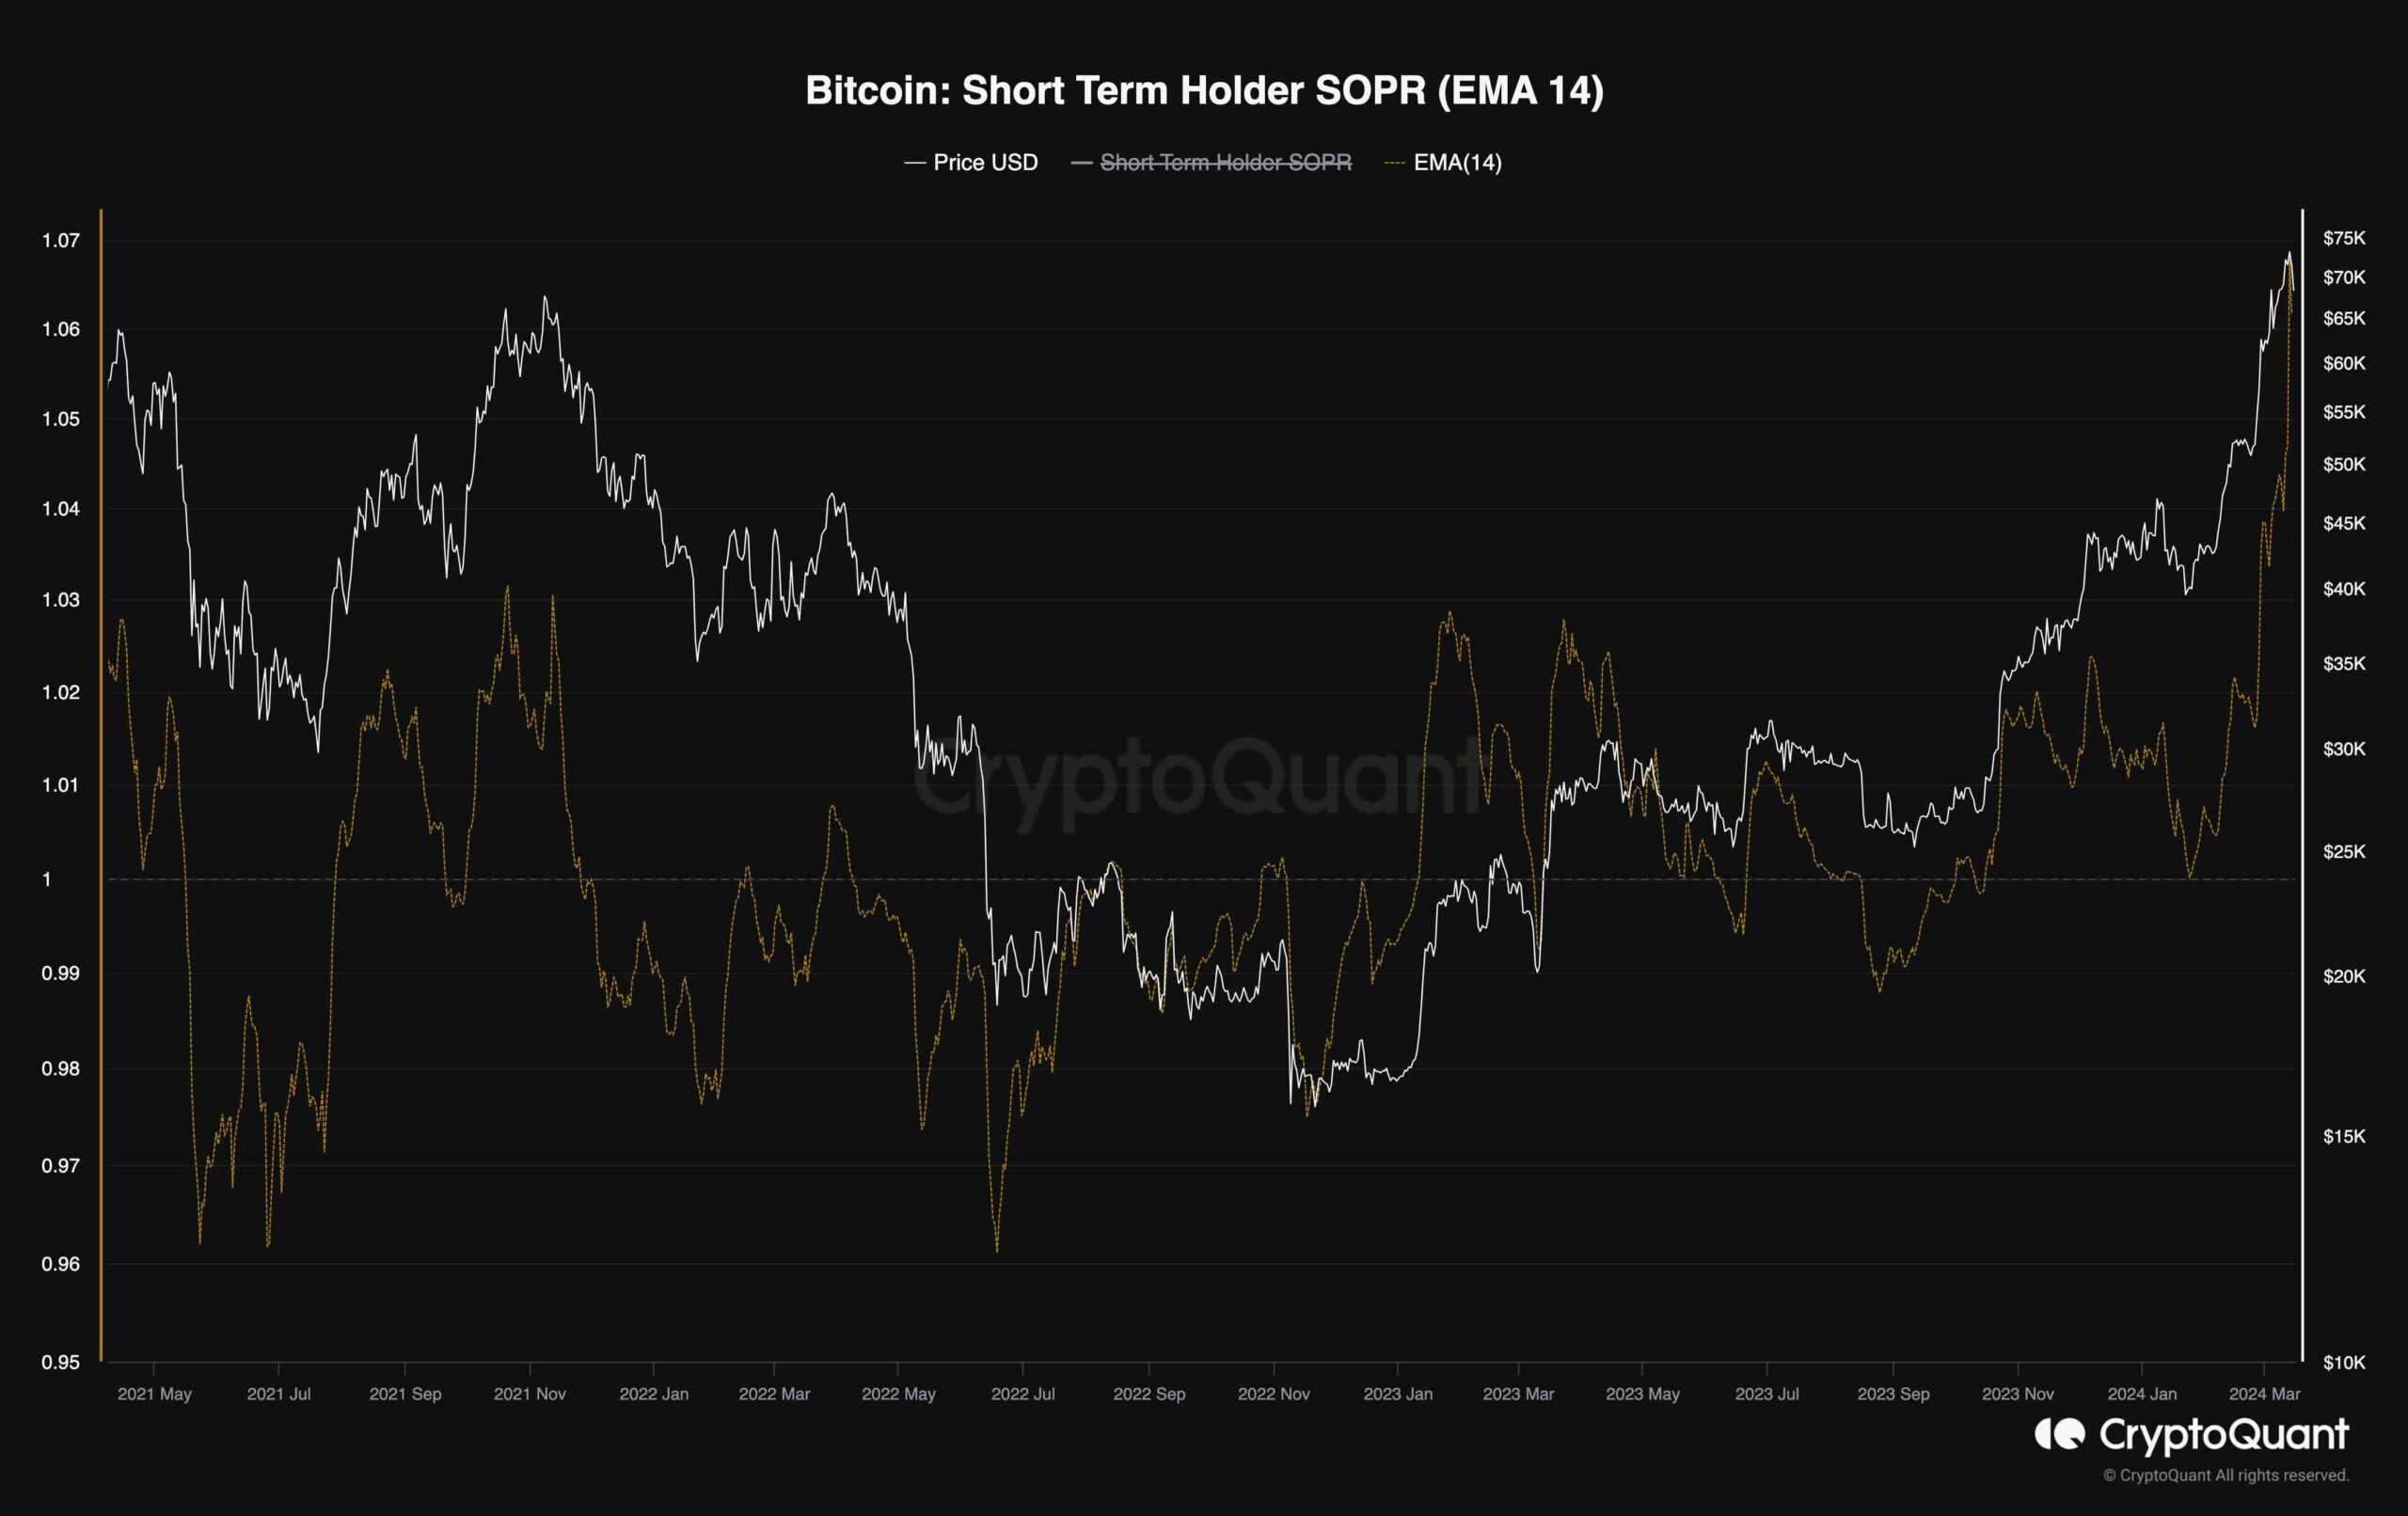
This chart demonstrates the Bitcoin Short-Term Holder Spent Output Profit Ratio. The STH SOPR calculates the ratio of profit realization by holders who have held their coins for less than 155 days. Values above one indicate realizing profits, while values below one are associated with realizing losses.
As the chart shows, the STH SOPR has been making a new record high, indicating that the short-term holders have been aggressively realizing their profits. Yet, their selling pressure has definitely contributed to the recent price drop. Until this selling behavior continues, the price can still drop lower in the coming weeks.
[ad_2]