
[ad_1]
A seasoned crypto whale experienced a dramatic financial turnaround – albeit briefly – trading $Fartcoin.
Lookonchain data shows this investor, once facing a $701,000 loss on the coin, secured a $127,000 profit by selling 2.69 million tokens for $2.47 million at $0.92 each. However, the euphoria didn’t last long.
The trader reinvested almost $1.98 million, purchasing 2.22 million $Fartcoin at $0.89 using 14,725 $SOL. Unfortunately, the token’s retracement has now pushed the whale back into the red, currently down $297K.
This whale flipped the script — turned losses into gains.
He sold 2.69M $Fartcoin($2.47M) at $0.92 3 hours ago, making a $127K profit.https://t.co/4YOOWwYVoz https://t.co/hFmdUNnS04 pic.twitter.com/OZt2Yp3KDw
— Lookonchain (@lookonchain) April 21, 2025
$Fartcoin’s Day of Roller-Coaster Price Action
$Fartcoin has been anything but predictable over the last 24 hours. The asset opened the day at around $0.8495, before experiencing an early dip that took it just below $0.83. This zone now acts as a strong support level.
Related: From FARTCOIN to AI Tokens: Mapping the Hottest Altcoin Trends Now
Shortly after the dip, the price made a swift and notable recovery, climbing past the $0.90 mark before encountering resistance at $0.925. That level has now become the key short-term ceiling for upward movement.
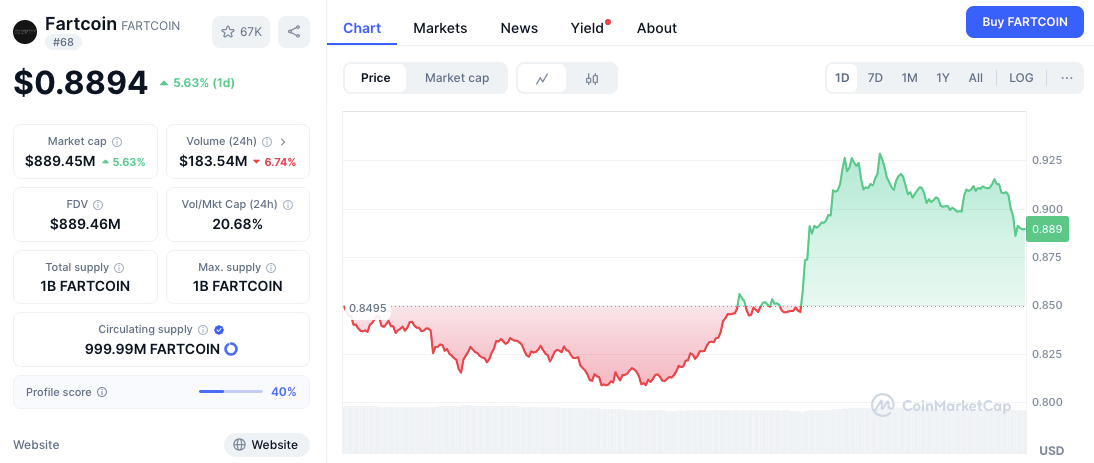
Source: CoinMarketCap
The price currently sits at $0.8871 (per CoinMarketCap), up 4.34% daily. However, this rise was not backed by volume strength. In fact, trading volume dropped by nearly 7%, signaling caution. Such divergence between price and volume may hint at a possible exhaustion in buying pressure.
Technical Indicators Signal Mixed Sentiment
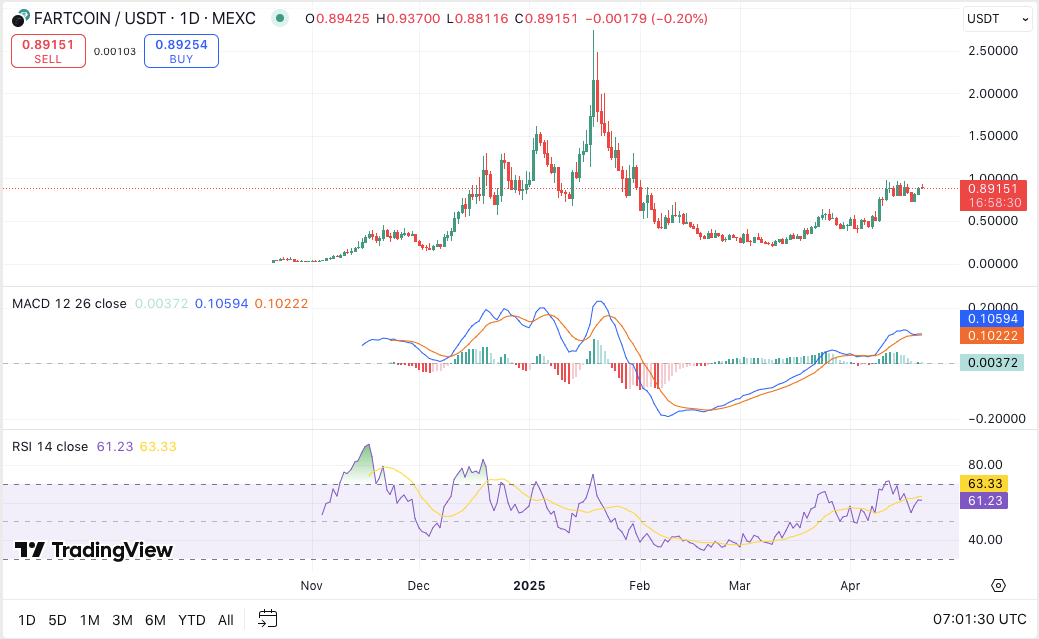
Fartcoin/USD daily price chart, Source: TradingView
The RSI (Relative Strength Index) currently reads 60.85, showing moderate bullishness but trending down from a recent peak of 63.30. This downward move implies waning momentum and a possible cooldown phase.
Related: Fartcoin (FARTCOIN) Price Prediction 2025-2030: Will FARTCOIN Price Hit $5 Soon?
On the MACD chart, the blue MACD line is still above the orange signal line. Yet, they appear to be converging, which often precedes a shift in trend. Additionally, the histogram has begun to flatline, further supporting the idea of consolidation.
Disclaimer: The information presented in this article is for informational and educational purposes only. The article does not constitute financial advice or advice of any kind. Coin Edition is not responsible for any losses incurred as a result of the utilization of content, products, or services mentioned. Readers are advised to exercise caution before taking any action related to the company.
[ad_2]